
$GOOG Trade Setup: Aggressive Entry & Target Levels
Looking to trade $GOOG? Get the complete aggressive trader setup with key support, resistance, entry triggers, and target levels driven by Google's AI push.
STOCK ANALYSISMOMENTUM STOCKSAI STOCKS
Why $GOOG is still trending?
The biggest driver is Google’s AI push after I/O. The market is reacting to Gemini growth, AI search expansion, new agent features like Gemini Spark, and a broader effort to make Search more AI-native. News flow also remains active around Google appealing the U.S. search antitrust ruling, which keeps legal risk in the story. That combination of AI optimism and regulatory uncertainty is exactly the kind of setup that keeps traders engaged.
Disclaimer: This article is for informational and educational purposes only and is not financial advice. Always do your own research and manage risk carefully.
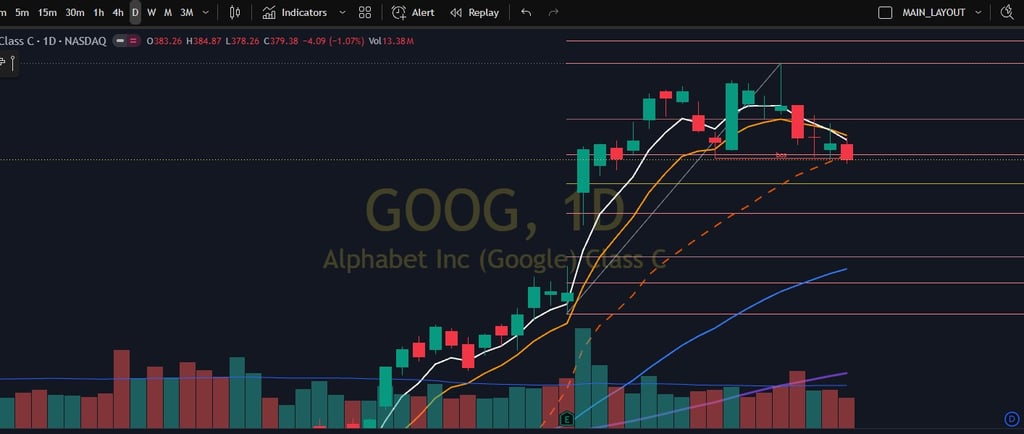
$GOOG is setting up for a cleaner short-term trading battle than a lot of mega caps right now. The stock closed around $379.46 on the latest session, sitting under a stacked resistance zone and just above an important support shelf. That gives aggressive traders a very simple framework: either play the reclaim through resistance, or play the breakdown through support.
Right now, the most important short-term levels are: Resistance: $381.5 to $382.0 Support: $378.5 to $379.0 Major pivot: $380.0
Those levels matter because price finished below the key short-term trend markers. The latest 15-minute readings show the 9 EMA near $380.07, the 21 EMA near $381.25, and session VWAP near $381.56. That creates a tight overhead resistance band in the $381.5 to $382.0 area.
On the downside, the lower Bollinger Band was near $378.48, and price traded into that zone late in the session before stabilizing. That makes $378.5 to $379.0 the first support traders should care about.
Aggressive bullish trade setup Entry idea: Enter long only if $GOOG reclaims $381.5 and starts holding above $382.0 on momentum. Aggressive trigger: A push through $382.0 with continued acceptance above VWAP improves the breakout case. Stop idea: A tight aggressive stop can sit under $380.8. A wider stop can sit under $379.8. If you want the setup to have more room, use a stop under $378.5, but that increases risk meaningfully. Bullish targets: First target: $382.5. Second target: $383.5. Third target: 385.0. How to manage it: If price clears $382.5 quickly, traders can trim partial size there and trail the rest toward $383.5 to $385.0. If price reclaims $382.0 but fails to hold above it, that failed breakout can turn into a quick exit signal.
Aggressive bearish trade setup Entry idea: Enter short only if $GOOG loses $378.5 with clean downside follow-through. Aggressive trigger: A break under $378.5 with continued trading below $379.0 suggests support has failed. Stop idea: A tight aggressive stop can sit above $379.7. A wider stop can sit above $380.2. If you want extra room for noise, a looser stop can sit above $381.0, but that changes the risk profile. Bearish targets: First target: $377.5. Second target: $375.0. Third target: below $375 only if selling accelerates broadly across tech. How to manage it: If price breaks $378.5 but immediately snaps back over $379.0, that is a warning sign for shorts. The cleanest bearish continuation likely comes only if $377.5 gives way after the initial breakdown.
Best aggressive trader read right now:
The chart slightly favors waiting for confirmation instead of forcing a trade in the middle. Why? Because $380 is acting like the magnet. When price is trapped between $378.5 support and $381.5 to $382.0 resistance, aggressive traders usually want the break, not the chop.
In plain terms: Above $382.0, momentum traders likely lean bullish. Below $378.5, momentum traders likely lean bearish. Between those levels, it is more noise-prone.
Options positioning that supports the setup The nearest expiry showed heavy activity around $380, $382.5, $385, and $390 calls, while puts were active around $380, $377.5, and $375. That reinforces the idea that $380 is the pivot and that $382.5 and $377.5 are the first real expansion points.
One important caution: high options volume does not automatically mean fresh bullish or bearish opening positions. Volume can include opening, closing, spreads, rolls, or hedges. Volume over open interest and ask-side activity can suggest aggressive positioning, but it is not full confirmation by itself until open interest updates.
Fast summary for readers: Bullish above: $382.0 Bullish targets: $382.5 | $383.5 | $385.0 Bearish below: $378.5 Bearish targets: $377.5 | $375.0 Main pivot: $380.0
Closing:
For aggressive traders, this is not a complicated chart. $GOOG either reclaims $382.0 and opens the door to a fast move back toward $383.5 to $385.0, or it loses $378.5 and starts a short-term downside rotation toward $377.5 and $375.0. Until one of those breaks happens, $380 is the fight.