$IWM Game Plan
$IWM Weekly Outlook: The Battle for $280 — Support Test or Breakout?
Date: May 3, 2026
📈 Executive Summary: The Pivot Point Market Pulse: 🟡 NEUTRAL-BULLISH / LEVEL-TO-LEVEL
As we enter the first full week of May 2026, the Russell 2000 ($IWM) is cooling off after a massive spring rally following the April policy shifts. Small caps are currently wedged in a high-stakes consolidation zone. While the "Risk-On" sentiment from last month’s prime-time address lingers, the market is now demanding proof of growth. We are tracking a critical $3.00 range that will likely determine the trend for the rest of Q2.
❓ What is the $IWM Outlook for This Week?
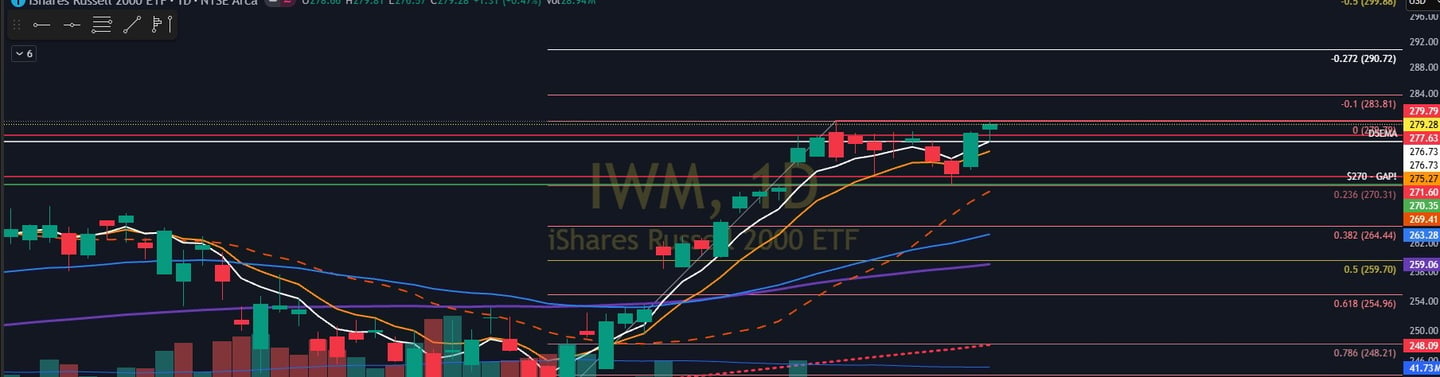
The $IWM outlook for the week of May 4, 2026, is strictly level-to-level. After rejecting the psychological $280 barrier, price is gravitating toward a "Value Area" test. We are looking for bulls to defend $276.73 to maintain the upward structure. A failure here opens the door for a deeper correction, while a daily close above $279.79 signals a "blue sky" breakout toward $285.
🌍 The Macro "Why": Post-Speech Consolidation
Why is the price stalling? The market is digesting the "New Normal" after the April policy updates.
Absorption of the April Rally The market moved fast in April. Small caps are currently "overextended" from their 50-day moving average. This sideways chop is healthy; it allows the "hot money" to exit and institutional "size" to accumulate before the next leg.
Interest Rate Equilibrium With inflation data showing signs of stabilization, the yield curve is flattening. This is traditionally a "sweet spot" for small-cap companies that rely on debt financing. If yields remain stable this week, $IWM has the fundamental green light to break $280.
📊 Technical Analysis: The $279.79 Wall
The technical setup is a textbook "Range Play" within a larger uptrend.
The Resistance Ceiling ($279.79): This isn't just a random number; it is the recent swing high where sellers aggressively stepped in. We need to see a 1-hour candle close and hold above this level to confirm that the supply has been absorbed.
The Floor of Support ($276.73): This level represents the "Point of Control" for the last two weeks of trading. As long as we stay above $276.73, the bulls remain in control of the primary trend.
Volume Profile: We are seeing "decreasing volume on the pullback," which is a bullish sign. It suggests that there isn't a mass exodus of sellers, just a lack of immediate buyers at the highs.
🎯 The Trade Terminal: $IWM Execution Plan
Below is the specific execution plan for the week of May 4.
📈 Direction: LONG (Pending Support Hold)
🚀 Trigger: Wait for a 15-minute "Hammer" or "Engulfing" candle at the support zone.
📍 Entry Zone: $276.73 - $277.50
🛑 Stop Loss: $274.90 (Hard exit if support fails)
🎯 Target 1: $279.79 (Scale out 50% / Move stop to break even)
🎯 Target 2: $284.50 (Trend Continuation)
💰 Max Risk: $500 (Standardized for a $25k - $30k active trading sub-account)
⏳ Timeframe: 2-4 Days (Swing Trade)
⚠️ Wild Cards & Risk Management
Small caps are the "canary in the coal mine." Here is what to watch:
⚠️ The "Fakeout" Breakout: If price spikes above $280 but immediately falls back below $279, this is a "Bull Trap." We exit any longs immediately.
⚠️ Employment Data Volatility: Any surprise in mid-week labor data could send the USD spiking. If the Dollar ($DXY) moves up sharply, $IWM will likely feel the pressure. The Contingency: If $IWM breaks below $276.00, we stay cash and wait for the $272 "Holy Grail" retest.
📝 Educational Corner: Trading "Level-to-Level"
What is Level-to-Level Trading? It is a disciplined approach where you ignore the "noise" of the news and focus only on the price zones where big institutions have placed orders.
By identifying $276.73 and $279.79, you aren't guessing where the market will go; you are identifying the "Battle Lines." You let the market show you who wins the battle at those prices, and then you simply "join the winning team."
✅ Final Pre-Trade Checklist
[ ] Check the $IWM Pre-Market: Is it gapping over $280? (Don't chase!)
[ ] Verify Support: Did $276.73 hold on the first 30-minute touch?
[ ] Monitor the VIX: If volatility is spiking, reduce your position size by half.
Disclaimer: This analysis is for educational purposes only and does not constitute financial advice. Past performance is not indicative of future results.