
$NVDA Trader Setup: Key Levels & Next Moves After Earnings
Looking to trade $NVDA after earnings? Get the complete trader setup with key support and resistance levels, breakout targets, and options flow analysis.
$NVDA$NVIDIA EARNINGSH200 CHINA DEAL
Bullish Setup for $NVDA
The bullish case starts with $NVDA holding the $214 to $215 zone and reclaiming $217 to $218.50 with strong volume. If bulls can do that, the stock opens the door for a move back into $220 to $221 first, then possibly $223.50 to $227.50. If momentum really returns, traders will start targeting a retest of $236.
For shorter-term traders, the cleanest bullish setup is probably a hold above $214 followed by a reclaim of $218. If that happens, it would suggest the post-earnings shakeout is getting absorbed instead of turning into a larger unwind.
Bearish Setup for $NVDA
The bearish case is straightforward: if $214 to $215 breaks cleanly, the market likely starts looking for $210 next. If that level fails, then the path opens toward $205 and possibly $200.
Bears also stay in control as long as $NVDA keeps rejecting $217 to $221 on bounce attempts. In that scenario, the stock is not rebuilding strength, it is simply making lower highs after an earnings fade.
Options Setup for $NVDA
Options activity is still extremely active, but the read is mixed rather than one-sided. There were large bullish call buys on the tape, including September $250 calls around $5.07 million and August $215 calls around $1.87 million. At the same time, there were also notable bearish and defensive prints, including September $215 puts for around $9.06 million and July $235 puts for around $2.16 million.
That tells traders two things. First, $NVDA remains a premium magnet, so institutions are still engaged. Second, the flow is not screaming one-way conviction right now. It looks more like traders are positioning for a big next move rather than agreeing on direction.
One important note on the options side: high volume versus open interest can hint at fresh positioning, but it does not confirm it until open interest updates. Also, some larger prints can be part of multi-leg or hedge structures, so traders should avoid treating every big print as a pure directional bet.
$NVDA Trader Setup: Support, Resistance, and Next Moves After Earnings
Why $NVDA is Trending:
$NVDA is trending because it remains the centerpiece of the AI trade. The latest quarter reinforced that AI infrastructure spending is still exploding, Blackwell demand is ramping, and management is now pitching even more upside through new product categories like Vera CPUs and broader AI factory buildout.
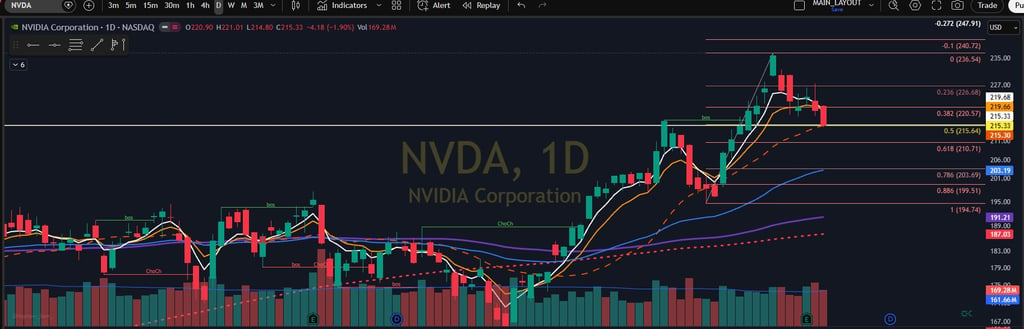
$NVDA is sitting in a high-volatility spot after a massive earnings-driven run into the $236 area and then a sharp cooldown back toward the mid-$215 zone. The latest regular session closed at $215.33, after trading as high as $221.01 and as low as $214.80. In the last several sessions, price has clearly shifted from momentum breakout mode into pullback and retest mode, which is usually where traders find the next directional decision.
The reason $NVDA is still one of the most watched names on the tape is simple: the company just posted first-quarter fiscal 2027 revenue of $81.6 billion, up 85% year over year, with data center revenue hitting $75.2 billion. Management also guided next-quarter revenue to around $91 billion, announced an additional $80 billion buyback, and raised the dividend. The market liked the numbers, but the stock pulled back anyway because expectations were already extremely high and traders are now debating whether that earnings beat was enough to justify the move into all-time highs.
At the same time, the stock is trending for a second reason: the market is questioning whether incredible results are enough after such a huge run. That tension between exceptional fundamentals and stretched expectations is exactly why the name keeps drawing both momentum traders and fade traders.
Current Support Levels for $NVDA
The first support zone is around $214 to $215. This level matters because it held late in the most recent session and also lines up with the current post-market area. Below that, the next meaningful support sits near $220 on a closing basis that has already broken, so now it becomes overhead resistance rather than support.
The stronger support shelf comes in around $208 to $210. That zone showed repeated trade acceptance earlier in May and would be the first major downside area if the current $214 to $215 pocket fails. Under that, traders will likely watch $200 to $205 as the deeper support band. That was a major reaction area earlier this month and would be the line where dip buyers probably need to show up in size to preserve the broader uptrend.
Current Resistance Levels for $NVDA
The first resistance zone is around $217 to $218.50. That was a repeated intraday stall area during the latest session and is the first level bulls need to reclaim. Above that, the next resistance sits near $220 to $221. That area was prior support and now acts like a flip zone.
If bulls can reclaim that, the next major resistance is $223.50 to $227.50, which captures the recent breakdown area and the prior earnings gap volatility. The biggest resistance remains $236 to $237. That is the recent high and the level that defines whether $NVDA is ready for trend continuation or not.