$QQQ Game Plan
$QQQ Weekly Outlook: The Tech Tug-of-War — Testing the $676 Ceiling
Date: May 3, 2026
📈 Executive Summary: The Tech Pulse Market Pulse: 🟡 NEUTRAL-BULLISH / CONFLUENCE SEEKING
As the calendar turns to May, the tech-heavy Nasdaq-100 ($QQQ) finds itself in a classic "cooling off" period after the high-octane growth seen throughout April. While the AI-driven narrative remains the structural backbone of the market, the short-term price action has entered a choppy range. Large-cap tech is currently playing a game of chicken with bond yields. We are watching a narrow corridor to see if this is a "launchpad" or a "rounding top."
❓ What is the $QQQ Outlook for This Week?
The $QQQ outlook for the week of May 4, 2026, is cautiously optimistic but strictly disciplined. After a failed attempt to hold the $676.00 handle on Friday, price has retreated toward institutional support. The goal for bulls this week is simple: defend $665.78. A successful defense here likely leads to a re-test of the highs. However, if the tech sector loses the $665 level, we expect a rapid "liquidity grab" down toward $658.
🌍 The Macro "Why": Yields and Earnings Digestion
Why is tech hesitant? The sector is currently balancing two opposing forces:
The "AI Efficiency" Narrative Following the April policy updates, investors are no longer buying tech on "hype" alone. They are looking for margin expansion. This week is about digesting the recent earnings from the "Magnificent" leaders. If the guidance remains robust, the "buy the dip" mentality will stay alive at our support levels.
The 10-Year Yield Correlation Tech is the most interest-rate-sensitive sector in the world. With the 10-Year Treasury hovering near a critical pivot point, $QQQ traders are keeping one eye on the "TNX" ticker. Higher yields mean lower valuations for growth stocks, which is currently the primary headwind capping the $676 resistance.
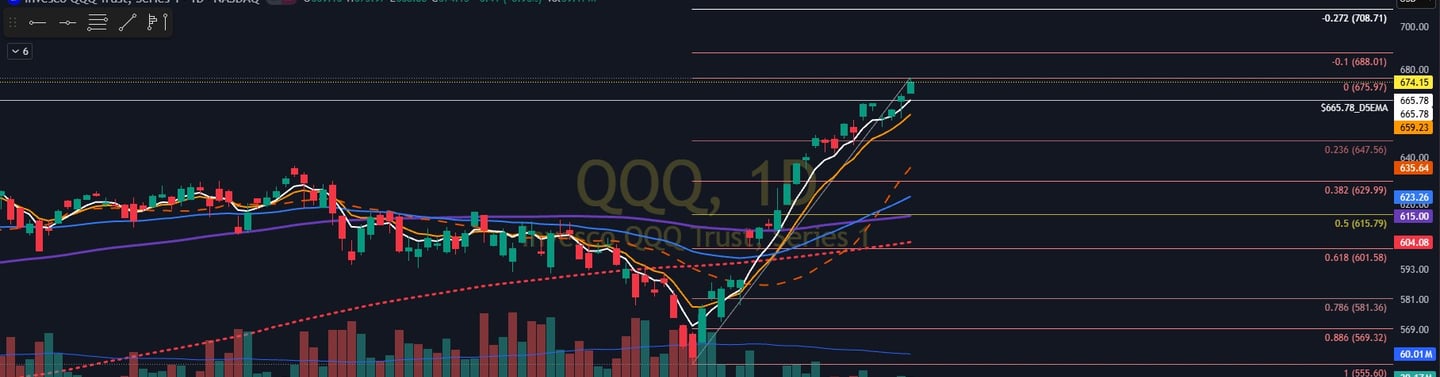
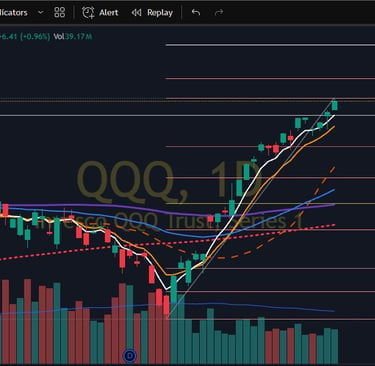
📊 Technical Analysis: The $665.78 Foundation
The $QQQ chart is currently exhibiting a "Bull Flag" on the daily timeframe, but the execution happens on the smaller levels.
The Resistance Ceiling ($676.00): This level has acted as a "supply zone" where institutions have been taking profits. We need a high-volume breakout and a 30-minute hold above $676 to confirm the next leg to all-time highs.
The Floor of Support ($665.78): This is our "Line in the Sand." This level aligns with the 21-day Exponential Moving Average (EMA), making it a high-probability zone for institutional buyers to re-engage.
Momentum Indicators: The RSI (Relative Strength Index) has cooled off from "Overbought" (75+) down to a neutral 55. This gives $QQQ "room to run" if the bulls decide to step in at support.
🎯 The Trade Terminal: $QQQ Execution Plan
Below is the specific execution plan for the week of May 4.
📈 Direction: LONG (At Support Reversal)
🚀 Trigger: Wait for a 15-minute "Hammer" or "Piercing Pattern" candle at the $665.78 zone.
📍 Entry Zone: $665.80 – $667.50
🛑 Stop Loss: $663.40 (Exit if the 1-hour candle closes below support)
🎯 Target 1: $672.50 (Take 1/3 off the table)
🎯 Target 2: $676.00 (Major Resistance / Scale out 50%)
🎯 Target 3: $682.00 (Runner for the "Blue Sky" move)
💰 Max Risk: $500 (Consistent with a professional $25k - $30k active trading sub-account)
⏳ Timeframe: Intraday to 3-Day Swing
⚠️ Wild Cards & Risk Management
Tech moves fast. Be aware of these potential "spoilers":
⚠️ The "Yield Spike": If the 10-year yield jumps unexpectedly mid-week, $QQQ will likely gap down. The Contingency: Do not "catch the falling knife" if $QQQ opens below $665.00. Wait for a reclaim of the level before entering.
⚠️ Sector Rotation: We are seeing some capital flow out of Tech and into Small Caps ($IWM). If the "Rotation" trade accelerates, $QQQ may stay "sideways" even if the broader market is green.
📝 Educational Corner: The "Tech-Yield Inverse"
Why do yields matter for $QQQ? In technical trading, we call this a Negative Correlation. When bond yields go up, the "Discount Rate" used to value future earnings also goes up. Since tech companies are valued based on their future profits, a higher yield makes those future dollars worth less today.
Pro Tip: Always have a chart of the 10-Year Yield (TNX) open next to your $QQQ chart. If you see $QQQ hitting support ($665.78) at the same time yields are hitting a resistance ceiling, you have "Confluence"—the highest probability setup a trader can find.
✅ Final Pre-Trade Checklist
[ ] Check Pre-Market Tech Leaders: Are $NVDA and $AAPL showing strength?
[ ] Verify the Level: Is $665.78 being defended with "buying tails" (wicks) on the 15-minute chart?
[ ] Review Economic Calendar: Are there any Fed speakers or inflation prints scheduled for the morning?
Disclaimer: This analysis is for educational purposes only and does not constitute financial advice. Trading involves significant risk of loss. Always manage your risk according to your personal financial situation.