$SPY Game Plan
$SPY Weekly Outlook: The Benchmark Battle — Defending the $716 Floor
Date: May 3, 2026
📈 Executive Summary: The Market Anchor Market Pulse: 🟡 NEUTRAL-BULLISH / STRUCTURAL DEFENSE
As the broad market enters the first week of May 2026, the S&P 500 ETF ($SPY) is currently in a "Price Discovery" phase following the volatility of late April. After a relentless climb, the index is showing signs of high-altitude fatigue. The structural trend remains bullish, but we are entering a phase where the "Easy Money" has been made, and the "Smart Money" is looking for concrete support. We are tracking a critical 9-point range that will set the tone for the monthly candle.
❓ What is the $SPY Outlook for This Week?
The $SPY outlook for the week of May 4, 2026, is a game of patience at the levels. The primary objective for the bulls is to maintain the psychological and technical integrity of $716.08. If this level holds on an initial test, we expect a relief rally back toward the $725.00 resistance ceiling. A decisive break above $725 puts the "730+ targets" back on the table. Conversely, losing $716.08 on a daily close suggests a deeper retracement toward the $708 liquidity gap.
🌍 The Macro "Why": Institutional Rebalancing
The market is currently wrestling with the "Price-to-Reality" gap following the recent prime-time economic addresses:
Earnings Season Tailwinds We are currently in the heart of the "fat tail" of earnings. While big tech ($QQQ) has provided the momentum, the broader $SPY components (Energy, Financials, Healthcare) are providing the floor. Institutional rebalancing usually occurs during the first week of the month, which often creates "trap" moves on Monday/Tuesday before the real trend reveals itself on Wednesday.
The VIX and Sentiment Volatility has remained suppressed, but we are seeing a slight "creep" in the V-IX. This suggests that while institutions aren't panic-selling, they are aggressively buying "insurance" (Puts). This hedging activity often happens right at major resistance like $725, creating a natural "lid" on the market until a fresh catalyst arrives.
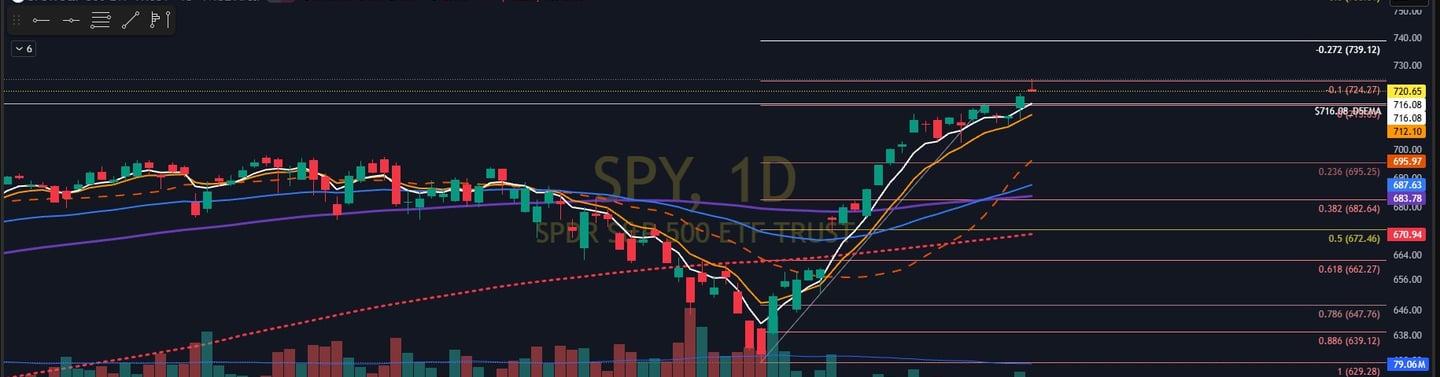
📊 Technical Analysis: The $716.08 Line in the Sand
The $SPY chart is showing a "Consolidation at Highs," which is generally a precursor to a breakout, provided support remains intact.
The Resistance Ceiling ($725.00): This is a heavy supply zone. Multiple attempts to breach this level in late April were met with high-volume selling. We need to see a "Full Body" daily candle close above $725 to confirm the trend continuation.
The Floor of Support ($716.08): This level represents a critical "High Volume Node" where massive institutional buying occurred earlier this spring. This is the ultimate "Must-Hold" level for the bullish thesis.
Moving Average Alignment: $SPY is currently trading above its 20-day and 50-day SMA, but the gap is narrowing. A touch of $716.08 would likely "reset" the moving average extensions and provide a healthier base for the next leg up.
🎯 The Trade Terminal: $SPY Execution Plan
Below is the specific execution plan for the week of May 4.
📈 Direction: LONG (At Support Reversal)
🚀 Trigger: Wait for a 30-minute "Bullish Divergence" or "Morning Star" pattern at the support zone.
📍 Entry Zone: $716.10 – $717.50
🛑 Stop Loss: $714.20 (Hard stop if the "Floor" is cleared by sellers)
🎯 Target 1: $721.00 (Standard profit-taking zone)
🎯 Target 2: $725.00 (Major Resistance / 80% position exit)
🎯 Target 3: $728.50 (Swing Runner)
💰 Max Risk: $500 (Standardized for a professional $25k - $30k trading sub-account)
⏳ Timeframe: 2-5 Day Swing Trade
⚠️ Wild Cards & Risk Management
$SPY is the "Ship" that moves the entire ocean. Watch these factors:
⚠️ The "Dollar Spike" ($DXY): If the US Dollar gains strength rapidly this week, it will act as an anchor on the S&P 500. The Contingency: If $SPY opens below $716.00, we do not go long. We wait for a "reclaim" of $716.08 before looking for an entry.
⚠️ The "Gap and Trap": If we gap up into $725 on Monday morning, do not chase. Fading a gap into major resistance is often the safer high-probability move for experienced traders.
📝 Educational Corner: Understanding "Volume Profile"
Why is $716.08 so important? In technical trading, we look for High Volume Nodes (HVN). These are price prices where the most shares have changed hands over a specific period. When $SPY returns to a price like $716.08, it is returning to a "Fair Value" area where both buyers and sellers agreed on the price in the past. If the buyers who missed the last move are still there, they will "defend" their entry, creating the support we see on the chart.
✅ Final Pre-Trade Checklist
[ ] Monitor Global Markets: Did the Nikkei or FTSE show significant weakness overnight?
[ ] Verify Support: Is $716.08 being respected on the 1-hour timeframe?
[ ] Check the 10-Year Yield: If yields are crashing, it's usually bullish for $SPY; if they are spiking, stay cautious.
Disclaimer: This analysis is for educational purposes only and does not constitute financial advice. All trading involves risk. Always consult with a licensed professional before making investment decisions.