
TSLA Stock Forecast & Technical Analysis Today: Price Prediction
Get our exact TSLA stock forecast and technical analysis today. We break down the latest TSLA price prediction for tomorrow following Tesla's massive Supervised FSD launch in China and the current robotaxi catalysts.
STOCK ANALYSISOPTIONS TRADINGTECH STOCKS
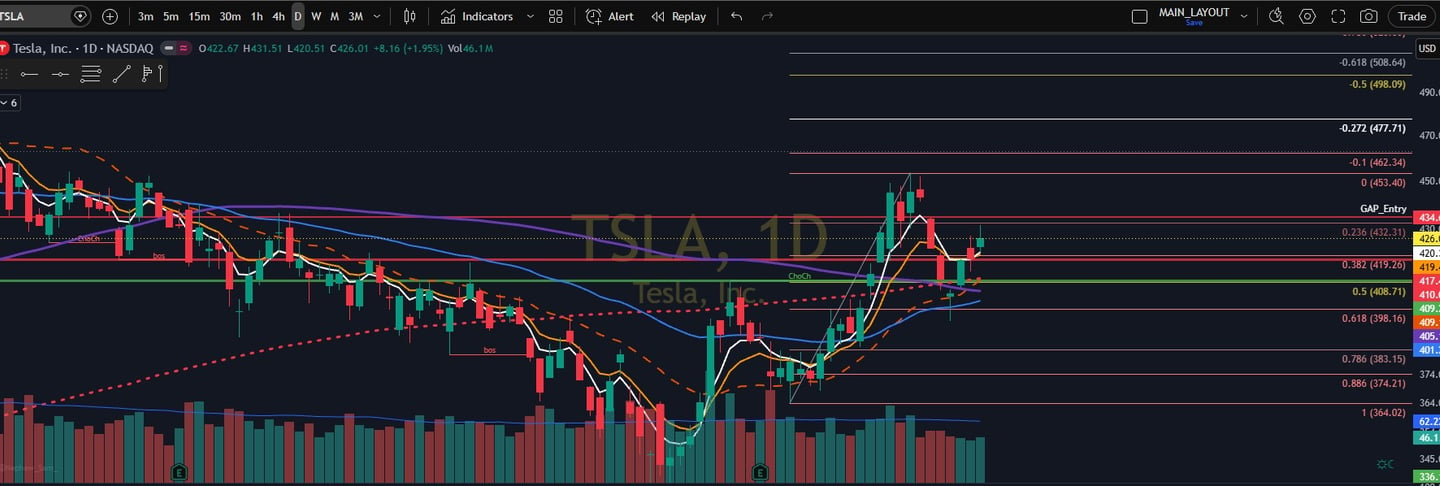
Table of Contents:
$TSLA Trader Setup:
Moving Averages and The AI Pivot Why $TSLA is Trending: $TSLA is trending because it is forcing a massive structural decision right at the 200-day moving average. The stock recently closed at $426.01, and if you look at the daily chart, price is navigating a major cluster of key levels. The 50-day SMA is sitting at $388.33, the 100-day at $405.12, and the critical 200-day at $410.03. The reason this matters for day traders and swing traders is that $TSLA just successfully pushed above that 200-day line. Institutional money uses the $410 level as the ultimate line in the sand between a long-term bullish and bearish regime. Because price is maintaining a cushion above this support, momentum buyers are stepping in looking for a sustained breakout.
The Fundamental Shift:
Innovation Over Manufacturing The fundamental driver keeping $TSLA in the spotlight right now is the aggressive pivot from traditional manufacturing to AI and robotics. The company just printed $6.41 billion in R&D expenditure for the latest fiscal cycle. That is a massive jump, signaling they are throwing serious capital at FSD, Optimus, and next-gen hardware. Even in a saturated EV market where they generated over $94.8 billion in revenue, the street is no longer treating this like just a car company. It is being traded like a diversified AI powerhouse, and that is exactly why the valuation base remains massive.
The Battleground:
Bulls vs. Bears The Bull Case for $TSLA: Bulls are buying this breakout because they are betting on high-margin software revenue from FSD subscriptions and incoming robotics breakthroughs. Even with recent revenue growth slowing down slightly, maintaining almost $3.8 billion in net income during a high-rate environment shows incredible operational resilience. The Bear Case for $TSLA: Bears are fading this move because the valuation is stretched, and the core auto margins are bleeding. Net profit margins have cratered from 15.5 percent down to roughly 4.0 percent thanks to aggressive global EV price wars. Trading at a P/E ratio over 350, the market is pricing in absolute perfection, making the stock highly vulnerable if those AI promises face any delays.
Final Thoughts and Trade Plan:
Right now $TSLA is the ultimate battleground stock. For active traders, the entire playbook revolves around that $410 level. If the 200-day moving average acts as a permanent floor, momentum can carry this much higher. If that level snaps, the bears will take control and immediately target the lower SMA bands.
DISCLAIMER: Not financial advice. This is a market commentary piece based on current price action and options flow, and conditions can change quickly.
TL;DR Trade Plan for $TSLA:
The entire setup right now revolves around one line on the chart: the $410 level, which is the 200-day moving average. Here are the two ways to play it.
The Bull Plan:
The AI Breakout The thesis here is simple: $TSLA is officially pivoting from a car company to an AI and robotics firm, and their massive $6.4 billion R&D spend proves it. As long as price maintains support above $410, you want to be buying dips into that 200-day moving average or buying the breakout above recent swing highs. The target is a quick retest of the $450 psychological resistance, driven by the promise of high-margin FSD software revenue.
The Bear Plan:
The Valuation Trap The bear thesis focuses entirely on fundamental decay. Core auto margins have cratered from 15.5 percent down to just 4.0 percent thanks to brutal industry price wars. If $TSLA rejects its current price around $426 or breaks back below $410, this entire rally was a fakeout. If that 200-day moving average snaps, the play is to short or buy puts. The target is a slide all the way back down to the 50-day moving average at $388 as the market suddenly remembers that a 350 P/E ratio is wildly expensive for shrinking margins.