
$TSLA Trade Setup: Breakout Levels & Next Moves
Looking to trade $TSLA? Get the complete trader setup with key support and resistance levels, options flow analysis, and the catalyst driving the trend.
STOCK ANALYSISTECHNICAL ANALYSISMARKET INSIGHTS
$TSLA trade setup: key levels, options activity, and why the stock is trending
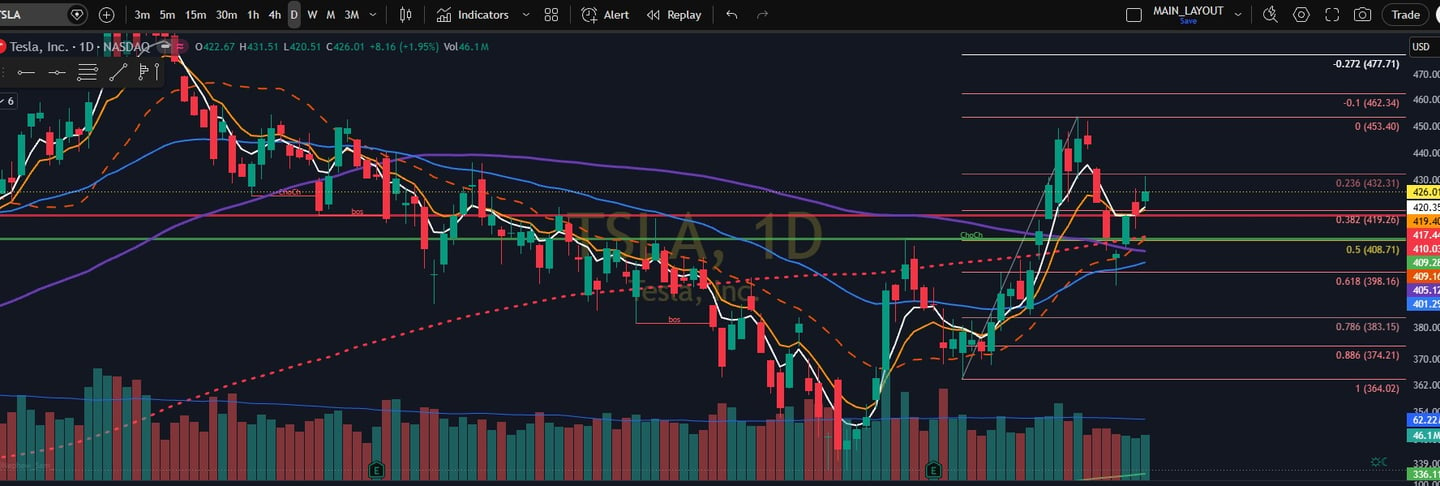
Tesla has put together a strong rebound, and that strength has turned $TSLA back into one of the market’s most watched momentum names. After climbing from roughly $352 in mid-April to the $426 area into late May, the stock is no longer in an easy accumulation zone. It is now pushing into a level where traders typically need fresh buyers, clean continuation, and supportive headlines to keep the move going.
That is what makes the current setup so interesting. The trend is still clearly constructive, but price is now close enough to resistance that execution matters more than narrative. For traders, this is less about blindly chasing strength and more about reacting to whether $TSLA can confirm a breakout or fail at a major inflection point.
Why $TSLA is trending
The current move in $TSLA has been driven by a familiar combination of themes: autonomy optimism, robotaxi enthusiasm, AI-related positioning, and renewed attention around China and FSD-related developments. In this environment, the market is not valuing Tesla strictly as an automaker. Instead, traders are leaning into the idea that Tesla is still an upside vehicle for future autonomy and platform-scale technology.
That narrative can be powerful, but it also creates a stock that is highly sensitive to headlines. When sentiment is favorable, momentum can accelerate quickly. When the story cools, the stock can retrace just as fast. That makes levels especially important here.
The key levels that matter
The first level bulls need to defend is $420 to $422. This is the most immediate support zone and the area that helps preserve the stock’s near-term momentum character. If $TSLA stays above that range, buyers remain in control of the short-term tape.
Below that, the more meaningful support sits in the $404 to $410 zone. If price pulls back into that area and stabilizes, bulls can still argue the broader uptrend remains intact. But if that range breaks, the chart starts to look more like a failed breakout than a healthy consolidation.
On the upside, traders should be focused on $431 to $432 as the first real breakout trigger. A clean push through that zone would open the door to a test of $443 to $445, which stands out as the next major resistance area.
In short, the setup is fairly clean: Above $432: bullish continuation remains in play Below $420: momentum starts to weaken Below $404: the trend likely needs a deeper reset
What the options activity is suggesting
Recent options activity has shown traders leaning heavily into short-dated calls near the current stock price, especially around contracts like: TSLA $430C 5/22/26 TSLA $427.5C 5/22/26 TSLA $425C 5/22/26
That kind of flow usually points to aggressive short-term speculation on upside continuation. In plain English, traders were willing to pay for immediate exposure to a further move higher.
Still, it is important not to overstate what the tape says. A trade printing on the ask can suggest urgency, but it does not guarantee the contracts were bought to open. Likewise, heavy volume relative to open interest can be suggestive, but it is not confirmed positioning until the next open-interest update. So the cleanest read is that $TSLA has been attracting strong upside participation, but much of it looks more like high-gamma momentum trading than automatic long-term conviction.
That distinction matters. Short-dated call interest can help fuel upside while momentum is working, but it can also disappear quickly if price stalls.
The trader setup
For bulls, the cleanest scenario is a hold above $420 followed by a decisive move through $431 to $432. If that happens, the next upside target is $443 to $445. In that type of setup, traders looking for options exposure may prefer a bit more time than same-day contracts to avoid excessive theta decay.
For bears, the better case is a rejection near resistance followed by a loss of $420. That would shift focus toward $404 to $410, where the next important test would likely happen. If that zone fails too, the market may start treating the recent run as overextended rather than strong.
$TSLA is trending because the market is once again paying for the autonomy and AI story, and the chart has responded with a sharp recovery. But after such a fast move, this is no longer a stock to chase without a plan. It is now a technical setup defined by a few very important levels.
As long as $TSLA holds $420, the bulls still have momentum. If it can clear $432, the path toward $443 to $445 stays open. But if support starts to give way, traders should be ready for the move to cool quickly.
DISCLAIMER: Not financial advice. This is a market commentary piece based on current price action and options flow, and conditions can change quickly.