$TTD Game Plan
$TTD Playbook: Navigating The Trade Desk Post-Earnings Crash
The Trade Desk ($TTD) has long been the gold standard for independent ad-tech, but the Q1 2026 earnings report delivered a "tale of two tapes" that has left the stock reeling in after-hours trading. For traders at SmartTradesZone, this setup represents a high-probability volatility play.
This playbook breaks down the fundamental health of the company, the critical technical levels shown on our daily charts, and the three distinct trading scenarios for the session on Friday, May 8, 2026.
I. The Fundamental Breakdown: Mixed Signals
The Trade Desk’s report was a paradox of growth and margin compression. While the top line remains resilient, the bottom line is feeling the weight of aggressive reinvestment and a shifting macroeconomic landscape.
The Numbers:
Revenue: $688.86M (Up 11.82% YoY) — A solid beat, showing that brands are still migrating toward programmatic advertising.
GAAP EPS: $0.08 (Down 20.00% YoY) — This is the primary driver of the post-market sell-off. Investors were looking for efficiency, but profitability metrics took a significant hit.
Q2 Guidance: Revenue projected at $750M+ with Adjusted EBITDA of $260M. This forward outlook is actually bullish, suggesting that the Q1 slump might be a localized dip rather than a trend.
The Bull Case: The company is doubling down on CTV (Connected TV) and retail media. The expansion of Koa Agents (AI-driven optimization) and the open-source OpenTTD initiative are long-term moats that keep retention above 95%.
The Bear Case: Profitability is decelerating. Macroeconomic headwinds and rising operating expenses are squeezing margins. Furthermore, the departure of the Chief Strategy Officer to OpenAI introduces an element of leadership uncertainty.
II. Technical Analysis: The Line in the Sand
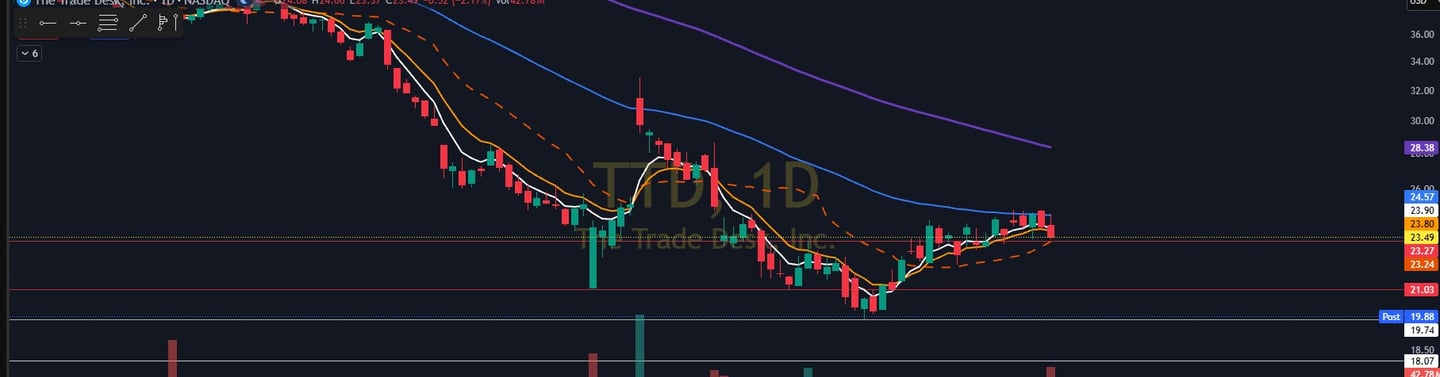
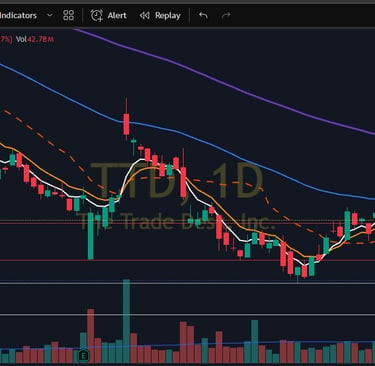
Turning to the daily chart, $TTD has entered a "value discovery" phase. The price action leading into earnings was already trending downward, and the post-market drop to $19.88 has brought us to a generational support level.
Key Support Levels (White Lines)
$19.74 (The Floor): This is our primary support line and the current 52-week low. In the after-hours session, the stock bounced almost exactly off this level. If this fails to hold on high volume tomorrow, we are looking at a "falling knife" scenario.
$18.07 (The Safety Net): If $19.74 breaks, this is the next structural level of interest. It represents a deep value zone from previous cycles.
Key Resistance Levels (Red Lines)
$21.03 (Immediate Ceiling): Formerly a support level, this now acts as heavy supply. Any relief rally will likely stall here as trapped bulls look to exit at "break-even."
$23.27 - $23.49 (The Gap): This is the pre-earnings "Value Area." Reclaiming this zone would require a massive catalyst or a significant short-squeeze.
$28.38 (The 200-Day SMA): The purple line on our chart sits far above current price action. Until $TTD can trade back above this level, the long-term trend remains firmly bearish.
III. The SmartTradesZone Trading Playbook
Based on the levels identified, here are the three scenarios to watch for tomorrow’s open:
Scenario 1: The "Capitulation Bounce" (Bullish Scalp)
The Setup: Price opens near $19.80 and successfully retests the $19.74 support without breaking.
The Trade: Enter a long position or sell Put Credit Spreads.
Target: $21.03 (First Resistance).
Stop Loss: A 4-hour candle close below $19.50.
Rationale: The 52-week low is a psychological magnet for buyers. A "double bottom" intraday could lead to a fast mean-reversion move toward the $21.00 level.
Scenario 2: The "Bear Flag" (Short / Put Play)
The Setup: Price attempts a morning rally to $20.50 but is rejected on decreasing volume, or it breaks $19.74 immediately at the open.
The Trade: Buy $19.00 Puts or initiate a Short position.
Target: $18.07.
Stop Loss: A move back above $21.03.
Rationale: When a major support level like the 52-week low breaks, it often triggers stop-loss cascades, leading to an accelerated drop.
Scenario 3: The "Dead Cat Drift" (Neutral/No-Trade)
The Setup: Price chops between $19.90 and $20.80 without a clear trend.
The Strategy: Avoid directional bets. This is an environment for Iron Condors or waiting for a more definitive breakout/breakdown.
Rationale: Earnings "hangover" sessions can often lead to low-volatility consolidation as institutional players digest the transcript.
IV. Broader Sector Context: Watching the Peers
To get a full picture of the market sentiment for tomorrow, keep an eye on these trending movers:
Unity Software ($U): Up 7% after-hours on strong guidance. If $U continues to fly, it may provide some "guilt-by-association" support to $TTD.
DraftKings ($DKNG): Showing mixed movement after beating revenue but missing EPS. It is a good gauge for risk-appetite in high-growth tech.
Arm Holdings ($ARM): Down 10% on smartphone demand fears. This suggests that the market is currently punishing anything less than a "perfect" report.
V. Risk Management & Final Thoughts
Trading earnings is inherently risky. For $TTD, the volatility is currently at a 30-day high.
Wait for the 15-Minute Rule: Do not chase the first 15 minutes of the open. Let the initial "algo-war" settle before picking a direction.
Size Down: Given the 15% drop after-hours, the bid-ask spreads will be wide. Reduce your standard position size by 50%.
Respect the Red Lines: If the price hits $21.03 and stalls, take profits. Don't hope for a "V-shaped" recovery to $24.00 on day one.
$TTD remains a fundamental powerhouse, but the market is currently re-pricing its growth trajectory. Trade the levels, not your bias.