
CVNA Stock Analysis: Weekly Chart Flashes Head & Shoulders Pattern
Get the ultimate $CVNA day trading playbook. Discover the weekly head and shoulders pattern with explicit long/short entry triggers and key macro support levels.
SWING TRADINGMACRO DATATECHNICAL ANALYSIS
Why is $CVNA Trending:
Carvana ($CVNA) has been one of the most explosive momentum stocks on the market, but the macro technical landscape is signaling a potential tectonic shift. While short-term buyers have been riding the momentum of record-breaking earnings, the weekly chart is flashes a major warning sign for long-term bulls.
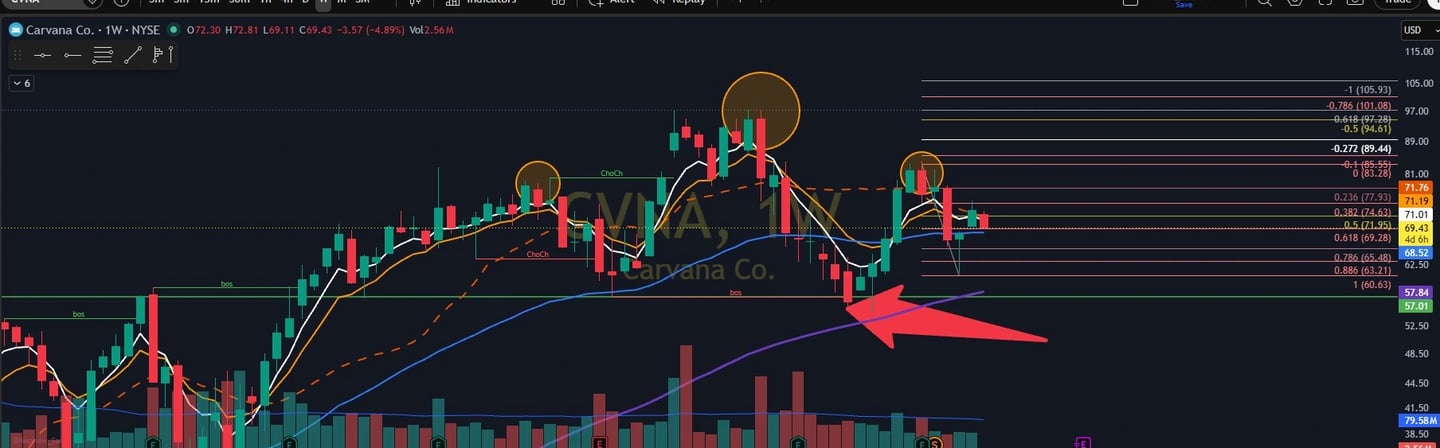
Looking at the multi-month chart, $CVNA is forming a massive Head and Shoulders pattern on the weekly timeframe. The left shoulder and head are locked in, and the price action has just completed a right shoulder rejection right under key structural resistance.
Whether you are looking to short the breakdown or buy the support bounce, the levels are incredibly clean. Here is your exact four-section execution playbook for $CVNA.
Carvana is sitting at a massive crossroads between aggressive institutional backing and major macro-technical distribution.
The Conviction List Spark: This morning, on June 1, 2026, William Blair officially added Carvana ($CVNA) to its highly-watched Analyst Conviction List. This institutional endorsement is bringing fresh volume to the tape as big money adjusts allocations for June.
Fundamental Momentum vs. Valuation: Carvana recently reported a monster Q1 earnings beat with an all-time record net income of $405 million, driven by a 40% year-over-year surge in retail units sold. However, analysts are deeply divided over whether its rapid growth justifies its current valuation or if its debt structure will catch up to it.
The Upcoming Catalyst: Investors are heavily anticipating Carvana's upcoming Inspection and Reconditioning Center tour in Elyria, Ohio, scheduled for Thursday, June 4, 2026. Traders are positioning heavily ahead of this corporate showcase, expecting high volatility.
$CVNA Long Setup:
Despite the looming macro Head and Shoulders pattern, you can never argue with price action. If the bulls absorb the selling pressure at key inflection points, a powerful trend-continuation trade unlocks. Use these exact parameters to plan your upside entries depending on where the price is trading for the day:
The Validation Level: If we hold the $70.95 area on any intraday pushes or pullbacks, the short-term bullish thesis remains intact.
First Upside Target: A confirmed hold of $70.95 sets up a clean long entry targeting $71.65.
The Extension Target: If momentum sustains over $71.65, the next major overhead target sits at $74.65.
$CVNA Short Setup:
The weekly chart highlights a very clear right shoulder rejection right at the 0.382 Fibonacci retracement level near $74.63. If the stock cannot maintain its upper bands, the macro breakdown will trigger a fast unwinding of long positions. Here is the short execution playbook:
The Resistance Ceiling: As long as we stay under the $70.90 area on any session bounces, the technical bias is heavily shifted toward the bears.
First Downside Target: An rejection under $70.90 unlocks a short position targeting immediate support down at $66.50.
The Flush Levels: A break below $66.50 accelerates the selloff down to $63.20.
The Macro Target: If the Head and Shoulders neckline completely snaps in the coming days, the final price target sits firmly in the $60.00 psychological area.
$CVNA Full Trading Plan:
Bearish Short Setup
Trigger: Stay under / reject the $70.90 area on any session bounces.
First Target: $66.50
Second Target: $63.20
Final Target: $60.00 area in the coming days.
Risk Management: Stop out if price recovers and holds above $71.00
Bullish Long Setup
Trigger: Confirmed hold of $70.95 on daily pushes or pullbacks.
First Target: $71.65
Second Target: $74.65
Risk Management: Stop out on a clean structural break below $70.50.
Trading Reminder: Manage your risk tightly, track the volume profile at the open, and always trade the reaction—not your bias.