
How to Trade Earnings Reports: Complete Guide (2026)
Master how to trade earnings reports in 2026. Discover volatility mechanics, risk mitigation shelters, and advanced day trading execution strategies.
The Mechanics of Earnings Volatility and Market Consensus
Trading an earnings report requires a fundamental shift in mindset. Amateur day traders treat earnings announcements like a binary casino game, guessing whether a company will beat or miss its earnings-per-share (EPS) estimates. Elite macro and intraday traders understand that the absolute numbers released by a corporation matter far less than how those numbers compare to the expectations already priced into the market. Earnings season is fundamentally a volatility event, not a directional guessing game.
The Dynamics of Implied Volatility and the Expected Move
In the days leading up to a major corporate earnings announcement, uncertainty builds. Market participants scramble to hedge their positions or speculate on potential price gaps. This surge in demand dramatically drives up the price of options contracts, causing a sharp inflation in Implied Volatility (IV).
Implied Volatility represents the market's forward-looking forecast of a stock's potential price swing. By analyzing the pricing of at-the-money straddles (simultaneously holding a call and a put at the same strike price), institutional desks calculate the "Expected Move." The Expected Move establishes the mathematical boundaries that the market anticipates the stock will respect upon the release of the report. Entering a day trade without knowing this boundary is equivalent to trading completely blind.
The Mechanics of the Volatility Crush
The exact moment the earnings press release hits the wires, the underlying uncertainty evaporates. The data is now public, Wall Street analysts instantly digest the forward guidance, and the immediate need for protective options premium vanishes. This triggers a structural phenomenon known as the "IV Crush."
During an IV Crush, the implied volatility of options drops precipitously, frequently collapsing by 30% or more within the opening minutes of the post-earnings session. This rapid deflation of premium means that directional options buyers can be 100% correct about the direction of the stock's move and still lose money, because the loss in volatility value outweighs the gain from the underlying stock price movement. For day traders, this mechanics-driven pricing collapse dictates exactly how and when risk must be structured.
To survive earnings season as a day trader, you must establish strict operational safe havens—structural execution rules and specific premium setups designed to protect your capital from catastrophic overnight gaps and unmanageable slippage. True safe havens in earnings trading are defined by delta-neutral positions and defined-risk strategies that insulate your account from unexpected executive guidance shocks.
The Pre-Market Isolation Sanctuary
The most absolute safe haven for an intraday trader is simple: never hold a speculative equity position through the actual release of the earnings report. The real edge does not exist in guessing the overnight gap, where retail traders are routinely chewed up by institutional algorithms executing in microseconds.
Instead, treating the pre-announcement window as a zero-exposure zone ensures that your trading capital remains entirely intact. By waiting until the report is released, the conference call is concluded, and the initial emotional market reaction settles, you transform a blind gamble into a highly calculated technical breakout or mean-reversion trade.
The Implied Move Structural Shield
For traders utilizing options to capture earnings price movements, the ultimate safe haven from the IV crush is the structural deployment of vertical spreads or iron condors placed completely outside of the calculated Expected Move.
By selling premium far outside the market’s anticipated boundary, you turn the destructive force of the IV crush into your primary profit engine. If the options market has priced in a $10 expected move on a stock, setting up a defined-risk credit spread at a $12 or $15 boundary creates a massive buffer. Even if the stock moves violently against your directional bias, as long as it remains within the wider expected parameters, the rapid post-earnings deflation of implied volatility will rapidly decay the options you sold, protecting your capital and delivering a high-probability win.
Earnings Safe Havens: Capital Preservation and Implied Move Shelters
Once the earnings data is live and the market opens, advanced tactical day trading shifts from theory to aggressive execution. Intraday volume surges to multiples of the daily average during an earnings reaction, creating pristine, highly liquid trends that can be systematically exploited using structural price action.
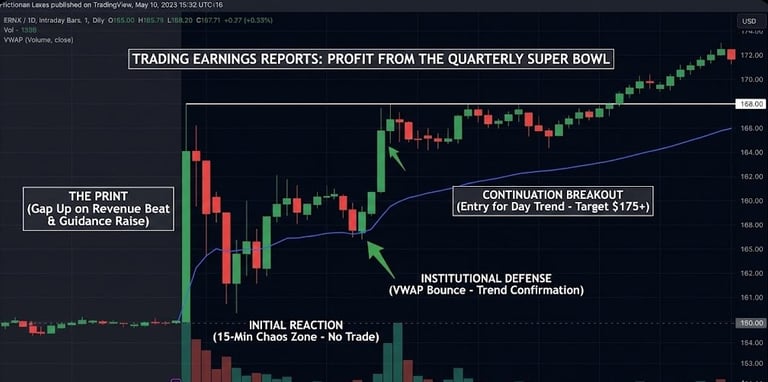
The Post-Earnings Opening Range Breakout
The primary tactical weapon for an earnings day trader is the 15-Minute Opening Range Breakout (ORB). Because earnings releases cause massive overnight price gaps, the first 15 minutes of the regular trading session represent a brutal tug-of-war between institutional funds rebalancing their blocks and retail traders reacting to headlines.
The Execution Framework: Allow the stock to print its high and low during the first 15 minutes of the opening bell. Do not touch it during this highly erratic window.
The Entry Trigger: Wait for a decisive 5-minute candle to close completely above the 15-minute range high (for a bullish continuation) or below the 15-minute range low (for a bearish breakdown). This breakout must be accompanied by volume that is at least 200% higher than the stock's standard volume average.
The Risk Mitigation: Place your hard stop-loss at the mid-point of the established 15-minute opening range. This creates a highly asymmetric risk-reward ratio, allowing you to risk a defined intraday distance to capture a multi-hour trend as institutional volume pours into the breakout direction.
Managing the Institutional Retest and Order Blocks
A frequent trap during major earnings mornings is the false breakout, where a stock surges past the opening high only to completely reverse as institutions use the retail buying liquidity to unload massive blocks of shares.
To filter out these traps, advanced tactical execution relies on the "retest strategy." Instead of buying the initial breach of resistance, wait for the stock to pull back and test the newly broken level from above. If the previous resistance level holds firmly as new intraday support, and a clear bullish order block forms on the 5-minute chart, it confirms that institutional buyers are actively defending the zone. This provides a secondary, incredibly safe entry point with an ultra-tight stop-loss placed immediately below the newly formed support floor.