
$INTC Stock Price Prediction Today
$INTC stock price slides to key support. See if Intel can defend the critical $117.05 pivot with our institutional trading plan.
STOCK ANALYSIS
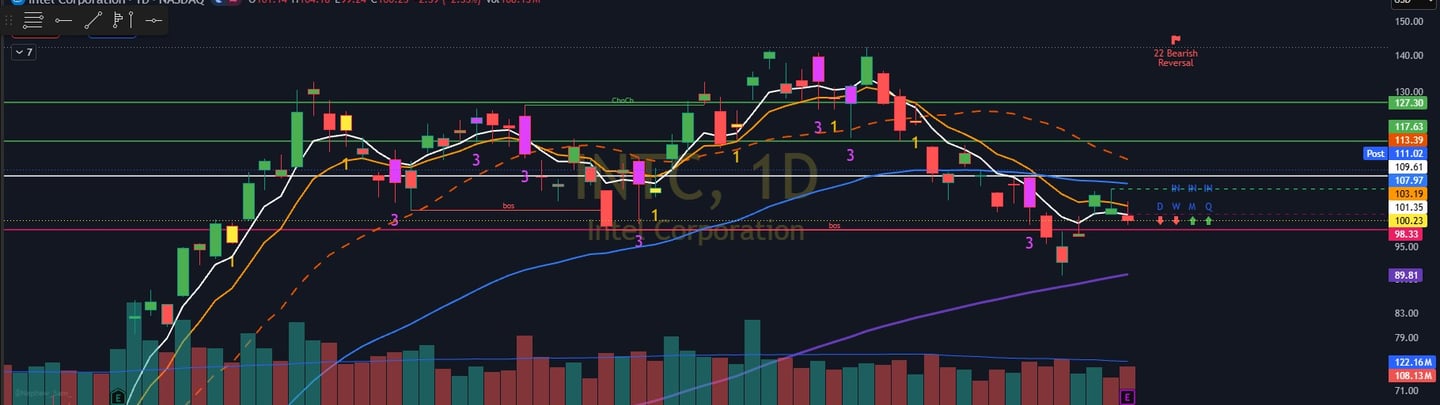
Table of Contents:
$INTC Q2 Earnings Breakdown & Guidance Summary
Quick Take: Intel just blew past expectations with its strongest quarterly revenue growth in over 15 years. Driven by relentless AI compute demand and accelerating foundry momentum, is this the semiconductor turnaround play traders have been waiting for?
Intel's latest quarterly results delivered a sharp signal that its long-term turnaround efforts are taking hold. Top-line momentum surged past original management targets, driven by robust demand across core CPU architectures and expanding foundry capabilities.
Here is the quick-hit breakdown of the reported numbers and forward outlook:
Top-Line Revenue Surge: Total revenue reached $16.1 billion (up 25% year-over-year), significantly outperforming Intel's prior guidance range of $13.8 billion to $14.8 billion.
Bottom-Line EPS Beat: Non-GAAP EPS landed at $0.42, topping analyst expectations, while GAAP EPS came in at $(2.16) amidst ongoing restructuring and balance sheet realignments.
15-Year Milestone: Management highlighted that this quarter represents Intel's highest single-quarter revenue growth rate in more than fifteen years.
Optimistic Q3 Guidance: For the upcoming third quarter, management forecasts revenue between $15.8 billion and $16.8 billion, with expected non-GAAP EPS of $0.38 (and GAAP EPS of $0.31).
Aggressive AI Infrastructure CapEx: To capitalize on surging AI workloads, Intel is expanding capital investments in equipment, substrates, and clean room facilities across its wafer foundry network.
Operational Discipline: Operating expenses continued to improve, with R&D and MG&A expenses down 6% year-over-year, reflecting stronger cost controls alongside top-line acceleration.
📊 $INTC Comprehensive Execution & Trading Plan
🟢 Scenario A: Bullish Long Execution Setup:
Primary Key Support: $109.50 (Must hold and defend on any pullback or retest) 🛡️
Execution Trigger: Look for a bullish retest and bounce above $109.50 accompanied by expanding buy volume or lower-timeframe reversal patterns 📈
Upside Profit Scaling Plan:
Target 1 ($113.50): Initial resistance test ➔ Trim 30%–40% of position and move stop-loss to breakeven ($109.50) 🎯
Target 2 ($117.60): Intermediate breakout target ➔ Take another 30% profit to lock in solid equity gains 💵
Target 3 ($121.00): Key structural overhead level ➔ Bank core gains on remaining main position 🚀
Target 4 ($127.00): Ultimate macro extension target ➔ Completely close out the final runner position 🏆
Bullish Invalidation: A clean daily candle close below $109.50 invalidates the long setup and triggers an immediate capital preservation exit 🛑
🔴 Scenario B: Bearish Short Execution Setup:
Primary Rejection Zone: $109.60 (Overhead supply and resistance ceiling) 🧱
Execution Trigger: Look for price to attempt a rally up to $109.60 but reject with high-volume upper wicks, shooting star candles, or flagging market structure 📉
Downside Profit Scaling Plan:
Target 1 ($107.95): Initial breakdown support ➔ Cover 40% of position and adjust stop-loss to breakeven 📍
Target 2 ($103.19): Core support zone ➔ Cover an additional 40% to lock in majority profits 🏦
Target 3 ($100.25): Ultimate downside runner target ➔ Close out the remaining 20% runner position at psychological support 💰
Bearish Invalidation: A strong daily candle close above $109.60 signals buyers have reclaimed control and invalidates the short thesis 🛑
Disclaimer: This article is for informational and educational purposes only and is not financial advice. Always do your own research and manage risk carefully.
❓ Section 3: Frequently Asked Questions (FAQ)
1. Why is the $109.50 – $109.60 price zone so critical for$INTC?
This narrow price range acts as the key market pivot point deciding trend direction. A sustained hold above $109.50 demonstrates aggressive buyer support following earnings, whereas a strong rejection at $109.60 confirms overhead institutional supply and triggers the short breakdown setup.
2. What main drivers fueled Intel's massive Q2 revenue beat?
Intel delivered $16.1 billion in total revenue (a 25% year-over-year expansion), beating management’s prior guidance range. The top-line acceleration was driven by surging demand for AI server compute, recovering CPU demand, and expanding foundry manufacturing momentum.
3. How should long traders manage risk after reaching Target 1 ($113.50)?
When $INTC hits Target 1 ($113.50), traders should trim 30%–40% of their total position size to lock in initial gains and immediately trail their stop-loss up to breakeven ($109.50). This secures a completely risk-free trade while riding the remaining position toward higher targets ($117.60, $121.00, and $127.00).
4. What price action invalidates the bearish short setup?
The short trade is immediately invalidated if $INTC registers a clean daily candle close above $109.60. A strong close above this supply ceiling confirms that buyers have absorbed overhead resistance, signaling a stop-loss exit to preserve capital.
5. What forward guidance did Intel management provide for Q3?
For the upcoming third quarter, Intel's management guided expected revenue between $15.8 billion and $16.8 billion, with non-GAAP EPS projected at $0.38, reinforcing expectations for a sustained operational turnaround in the second half of the year.