
TESLA ($TSLA) Post Earnings Stock Analysis & Key Levels
Get real-time technical levels, earnings updates, and high-conviction trade setups for $TSLA. Track support, resistance, and risk parameters.
STOCK ANALYSIS
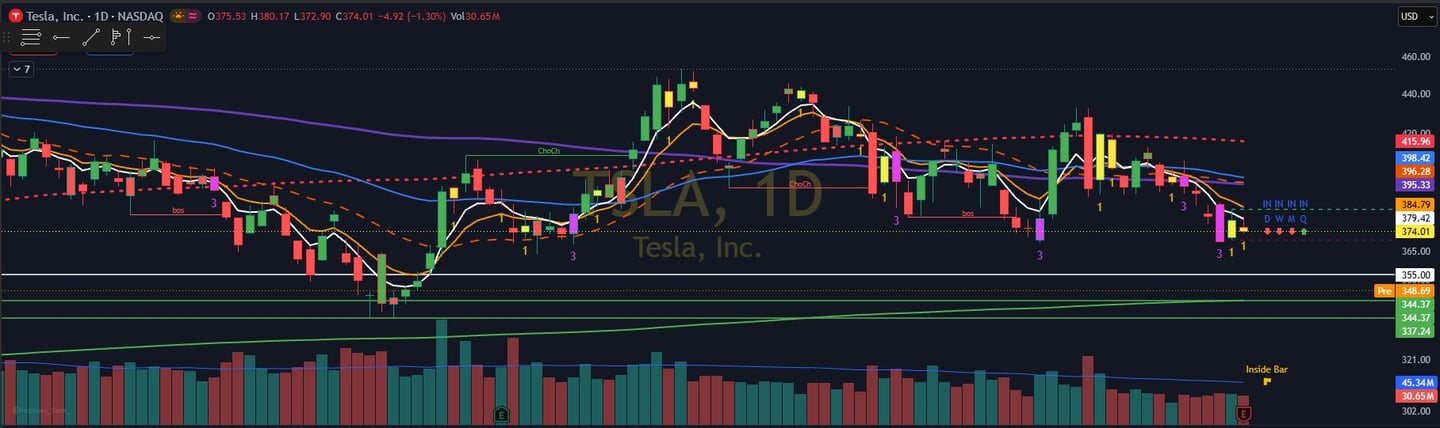
TABLE OF CONTENTS:
$TSLA Post Earnings update
⚡ Is $TSLA Stock a Trap or a Generational Buying Opportunity? Q2 Earnings Breakdown
⚡ Is $TSLA Stock a Trap or a Generational Buying Opportunity? Q2 Earnings Breakdown
Quick Take: Tesla just posted a massive top-line revenue beat powered by record deliveries and surging energy storage—yet bottom-line profits took a temporary hit from massive AI infrastructure investments. Is Wall Street mispricing Tesla's rapid transformation into an AI and autonomy behemoth?
📌 $TSLA Q2 Earnings Breakdown & Guidance Summary:
Tesla’s latest quarterly earnings print delivered a classic "top-line boom meets margin squeeze" narrative. While short-term traders hyper-focused on compressed earnings per share, management made it clear that capital is being aggressively reallocated to build out the next major growth engine: full autonomy, AI computing power, and scalable energy solutions.
Here is a quick snapshot of the key financial results, performance highlights, and guidance updates:
Top-Line Revenue Surge: Total revenue surged to $28.24 billion (up significantly year-over-year from $22.5 billion), easily shattering Wall Street consensus forecasts of $25.7 billion–$26.0 billion.
Bottom-Line EPS Squeeze: Adjusted EPS landed at $0.33, missing the consensus estimate of ~$0.51 as pricing adjustments, higher operational expenses, and heavy R&D spend dragged on quarterly net income ($1.11 billion).
Automotive vs. Energy Breakdown: Automotive revenue generated $25.10 billion, while the Energy Generation and Storage segment continued its explosive expansion, bringing in $3.14 billion at industry-leading gross margins.
Heavy AI Infrastructure & CapEx: Research & Development expenses climbed to $2.37 billion, driving first-half capital expenditures past $8.28 billion. Management is aggressively funding AI compute power, Robotaxi scaling, FSD (Supervised), and Optimus humanoid development.
Bulletproof Liquidity Fortress: Tesla closed out the quarter with $43.52 billion in cash and short-term investments, providing a massive cushion to self-fund capital investments without diluting equity.
Forward Guidance & Strategic Outlook: Management reaffirmed long-term vehicle scaling targets while prioritizing deployment schedules for full self-driving fleets, lower-cost vehicle platform entry points, and expanded energy storage deployments.
📉 Comprehensive Short Trading Plan
🎯 Trade Setup Overview:
Trade Bias: Bearish / Short Contraction Play 🔻
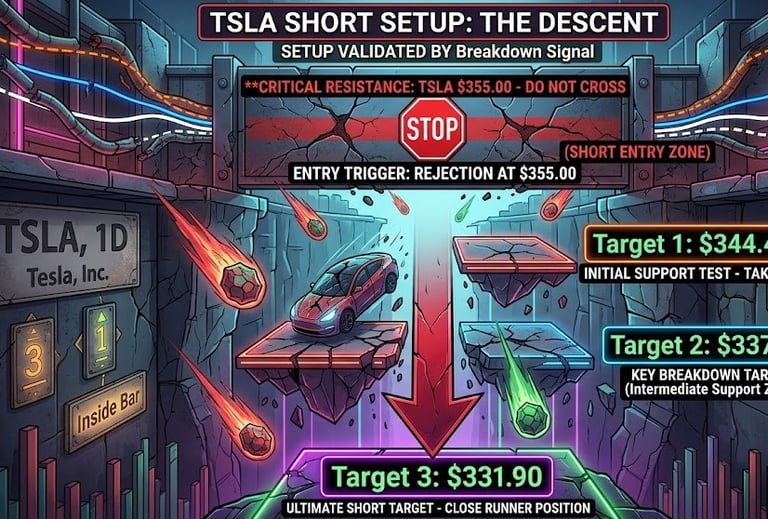
Key Short Entry Zone: $355.00 (Primary Overhead Resistance / Rejection Level) 🛑
Primary Objective: Capitalize on downside rejection from resistance toward key support zones 📉
Trade Style: Technical Rejection & Range Breakdown Play 📊
🚪 Entry Strategy & Execution Triggers:
Primary Entry Trigger: Look to open a short position as price retests $355.00 with declining buying volume and lower-timeframe reversal signs ⏳
Confirmation Signals: Wait for a 15-minute or 1-hour candle rejection wick, shooting star pattern, or a clean breakdown below initial intraday support 📊
Execution Style: Use limit orders scaled in between $354.50 and $355.00 to minimize slippage and ensure tight risk control 🎯
💰 Profit Target & Scaling Strategy:
Target 1: $344.40 (Initial Support Test) 📍
Price Movement: ~$10.60 per share downside gain (~2.99% return) 💵
Action: Trim 40%–50% of total position size to lock in initial profits 🏦
Management: Immediately shift Stop Loss to Breakeven ($355.00) to ensure a risk-free trade 🛡️
Target 2: $337.30 (Intermediate Support Zone) 📍
Price Movement: ~$17.70 per share downside gain (~4.99% return) 💵
Action: Trim an additional 30%–40% of initial position size to bank core gains 💰
Management: Trail Stop Loss down to Target 1 ($344.40) to protect locked-in equity 📉
Target 3: $331.90 (Ultimate Downside Expansion Target) 📍
Price Movement: ~$23.10 per share downside gain (~6.51% return) 💵
Action: Close remaining 10%–20% runner position at major daily support shelf 🏆
Management: Completely exit the trade and re-assess market structure 🛑
🚨 Risk Management & Stop Loss Rules:
Hard Stop Loss Level: $360.50 (Placed strictly above key resistance to cap maximum risk at $5.50 per share) 🛑
Invalidation Criteria: A daily candle close above $355.50–$356.00 invalidates the bearish thesis and triggers an immediate manual exit ❌
Risk-to-Reward Ratio (R:R) Profile:
R:R to Target 1: ~1.9 : 1 ⚖️
R:R to Target 2: ~3.2 : 1 ⚖️
R:R to Target 3: ~4.2 : 1 ⚖️
⚙️ Position Sizing & Trade Management:
Account Risk Limit: Limit overall trade exposure so total potential loss does not exceed 1%–2% of account equity 🔐
Trailing Stop Execution: After Target 1 is secured, utilize a trailing stop based on the 9-EMA or lower-timeframe lower-high market structure 📉
Disciplined Execution: Avoid chasing price if market opens significantly below $355.00 without giving a retest 🛑
❓ Frequently Asked Questions (FAQ)
1. Why is $355.00 considered a critical level for this short setup?
$355.00 serves as a major technical overhead resistance and supply zone. Rejections at this level indicate strong selling interest and present a favorable risk-to-reward entry point before potential downside expansion.
2. What are the key profit targets for this trade execution plan?
The profit targets are structured in three distinct scaling tranches to systematically lock in gains:
Target 1 ($344.40): Initial support test to take first profits and move stop-loss to breakeven.
Target 2 ($337.30): Intermediate support zone for banking the core position gains.
Target 3 ($331.90): Ultimate support target for closing out the final runner position.
3. How do Tesla's Q2 financial results influence the short thesis?
While Tesla delivered strong top-line revenue performance driven by vehicle deliveries and energy storage growth, compressed margins and increased capital expenditures for AI infrastructure created short-term bottom-line pressure. This fundamental margin squeeze aligns with technical overhead resistance, favoring short-side momentum.
4. Where is the stop-loss placed, and what is the maximum trade risk?
The hard stop-loss is placed at $360.50, strictly above the key resistance zone. This limits maximum trade risk to $5.50 per share, maintaining an attractive Risk-to-Reward (R:R) ratio exceeding 4:1 toward the final target.
5. What market conditions would invalidate this bearish setup?
A clean daily candle close above $355.50–$356.00 demonstrates that buyers have reclaimed control of momentum. Such a breakout invalidates the downside thesis and triggers an immediate exit to preserve capital.