
(IREN) Stock Analysis: Trading the 2 Billion Debt Dilemma: It needs to hold $53.10
$IREN fell right into major support zone. Is it possible it has more momentum left?
STOCK ANALYSISMOMENTUM STOCKS
$IREN Bias:
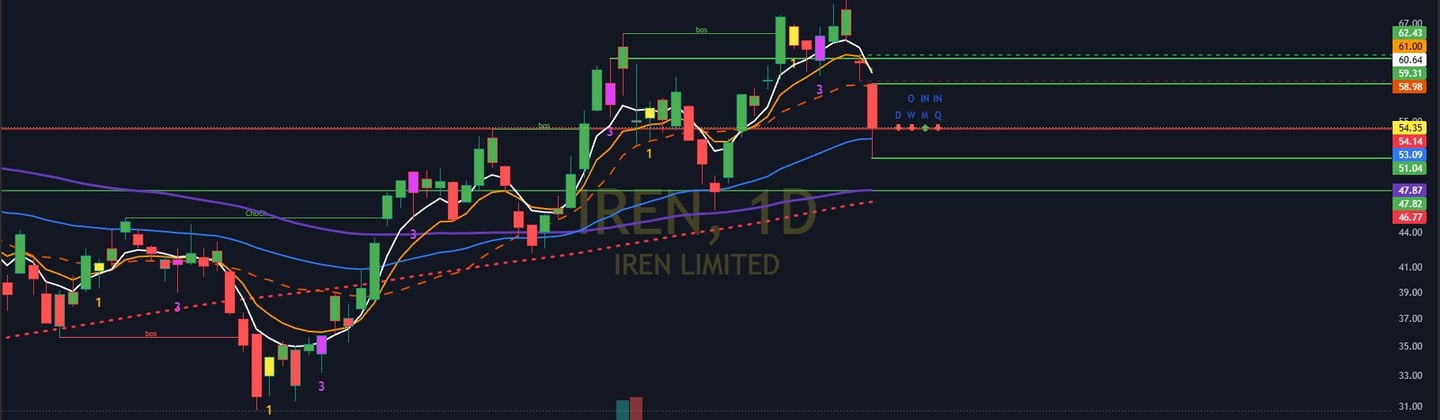
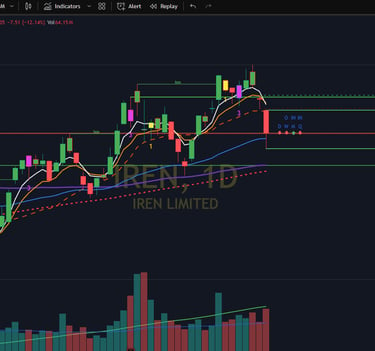
$IREN is trending because the chart shows a clean higher-high, higher-low structure after a strong move up, and it’s now consolidating above key moving averages instead of breaking down. The stock also had a heavy-volume push higher, which usually tells you institutions or momentum traders were involved, and it’s still holding near $60 after hours, which keeps the bullish structure intact.
In short: momentum is strong, trend structure is intact, and buyers are still defending the breakout area.
Mildly bullish, but still at a decision point.
$IREN Long Setup:
The Market Catalyst: Iris Energy ($IREN) is experiencing significant institutional accumulation following recent momentum across data center expansion headlines. On the daily chart, the price action is coiling tightly beneath a major structural pivot line, setting up a high-probability breakout for momentum swing traders.
The Bull Case Trigger: * The Execution Level: Look for a definitive daily candle reclaim and hold above $53.10. This represents a key liquidity pocket where sellers have previously stepped in.
Trend Confirmation: The setup becomes significantly stronger if the bulls can sustain price acceptance above $54.15, which aligns with a volume profile breakout point.
Upside Targets to Pay Yourself: If the breakout triggers with high relative volume, we are targeting three core target extensions:
$58.00 (Short-term psychological resistance)
$60.64 (Daily gap-fill target)
$62.45 (Macro squeeze extension)
Risk Management & Invalidation: Always protect your capital. If the market triggers the long entry but drops back below $53.10 and fails to reclaim it quickly, the breakout thesis weakens significantly. A sustained breakdown below this level invalidates the long setup.
$IREN Short Setup: Technical Bear Case & Breakdown Levels:
The Sell-Side Catalyst: While Iris Energy ($IREN) has maintained a strong structural uptrend on the macro timeframes, the price action is currently stalling directly beneath heavy overhead distribution. Chasing the asset at these extended levels introduces severe risk. If buyers fail to clear immediate supply pockets, a tactical short-selling (or "fade") opportunity opens up for intraday and swing traders looking to catch a mean-reversion pullback.
The Bear Case Trigger: * Initial Supply Rejection: Watch for a definitive failure or rejection wick near the $53.10 key resistance pivot. This proves sellers are actively defending the block.
Confirmation Entry: The high-probability short execution triggers upon a clean loss and breakdown of $51.05. Securing price acceptance below this local shelf confirms that momentum has shifted back to the bears.
Downside Targets to Take Profit: If the breakdown triggers on expanding relative volume, expect a fast flush toward these key historical liquidity pools:
$51.00 (Immediate psychological support shelf)
$47.00 (Daily demand zone and volume profile gap-fill area)
$46.00 (Macro ascending trendline retest target)
Bear Invalidation & Risk Management: Always protect your trading capital. The short thesis is completely invalidated if $IREN prints a clean reclaim and hold back above $53.10. If the bulls force acceptance above this line, short sellers must stop out immediately, as it sets the stage for an aggressive short squeeze breakout.
The Macro Bottom Line:
Zooming out on the higher timeframes, $IREN retains a bullish market structure, but it is not a safe, low-risk buy just yet. Because the stock is coiled directly underneath macro breakout resistance, your overarching playbook should respect these wider parameters:
The Aggressive Breakout: Long setups become highly favored only if the stock can decisively reclaim and hold $60.98.
The High-Beta Fade: Look to scale into short positions if the price action loses the $58.12 structural pivot.
The Structural Shift: If the intermediate support at $55.81 snaps, the entire macro breakout thesis weakens significantly, giving the bears full control over the medium-term trend.
$IREN Full Trading Plan & Execution Matrix (TL;DR):
To maximize execution precision and maintain strict risk management on Iris Energy ($IREN), utilize this structural blueprint for your trading sessions. This summary breaks down the exact if-then scenarios for both long and short biases based on critical institutional liquidity pivots.
The Long Execution Matrix:
The Tactical Entry (Hold/Reclaim Setup): Your optimal risk-to-reward long positioning activates on a successful test and hold, or a clean intraday reclaim, of $53.10. This level serves as the immediate line in the sand for buyers to sustain momentum.
The Momentum Entry (Breakout Setup): For a cleaner, high-confidence entry with less overnight exposure, wait for a decisive breakout above $54.15. Ensure this breakout occurs on expanding relative volume to confirm institutional participation and avoid a bull trap.
The Short Execution Matrix:
The Aggressive Intraday Fade: If the price spikes into supply but experiences a clear rejection failure back under $53.10, aggressive mean-reversion traders can initiate a short position to fade the distribution back toward local liquidity shelves.
The High-Probability Breakdown: A highly structured, heavy-size short setup activates if the critical support at $51.05 breaks down. Snapping this level shifts the short-term trend completely to the bears, opening the floodgates for a swift flush into deeper downside targets.
Strategic Bottom Line:
The macro market structure for $IREN remains undisputedly bullish, but managing risk means avoiding chasing extended vertical moves. Do not force an entry in the middle of a range. This setup heavily favors long positions over multi-day holds, provided the asset maintains clear price acceptance above the major anchor level of $53.10.