
$IWM Key Levels: Has to holdkey level of $290.60
Russell 2000 ($IWM) tests key support at $291.60 following IRAN signing of Agreement. Get our full technical trading plan detailing critical long and short targets.
STOCK ANALYSISMARKET INSIGHTS
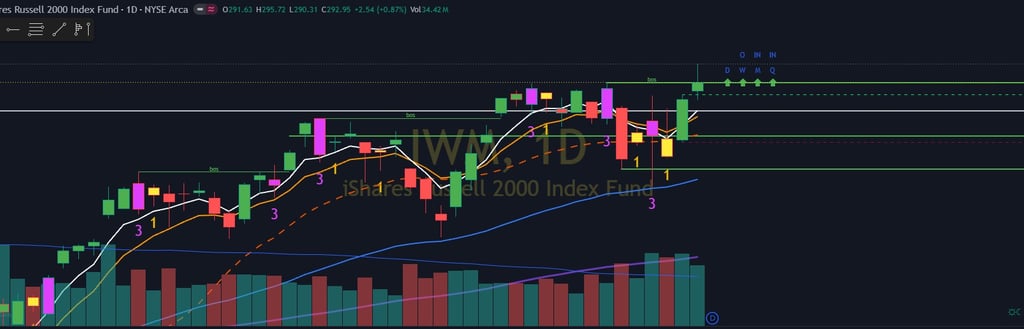
TABLE OF CONTENTS:
Why is $IWM Trending:
The iShares Russell 2000 ETF ($IWM) is experiencing massive trading volume after a punishing Friday distribution session that wiped out over 3.5% of its value, driving the small-cap index from its recent high of $292.01 down to close precisely at a crucial technical shelf of $281.65. This aggressive liquidation event was triggered by the systemic macro shockwave of the May nonfarm payrolls report, which added 172,000 new jobs—nearly doubling economic consensus forecasts. Because small-cap companies are uniquely burdened by a higher proportion of floating-rate debt and sensitive borrowing costs, the ensuing spike in the 10-year U.S. Treasury yield to 4.54% left a clear institutional footprint of risk-off de-risking across the entire index block.
Core Macro & Small-Cap Catalyst Matrix:
Rate-Sensitive Liquidation: Small-cap equities bore the brunt of the "good news is bad news" employment data, as an extended high-interest-rate environment directly threatens the cost of capital for Russell 2000 components.
Yield Curve Pressure: The rapid ascent of the 10-year Treasury yield to 4.54% triggered systematic rotation out of high-beta growth components and into fixed-income or large-cap defensive postures.
Crucial Structural Floor Test: A single-session plunge has slammed $IWM straight into its primary horizontal demand node at $281.65, setting up a binary trend-continuation or multi-week breakdown scenario for the week ahead.
$IWM Long Setup:
For market bulls looking to initiate a mean-reversion long campaign, the primary technical requirement is to witness a definitive support hold and structural supply rejection at the $281.65 pivot zone. Intraday price action must demonstrate active bid absorption at this level during early sessions, signaling that institutional accumulation is step-entering the tape to defend the broader uptrend. If $IWM can solidify this area as firm support, it will validate a localized oversold condition and lay the groundwork for a technical squeeze into overhead liquidity pockets.
Upon a confirmed intraday trigger or strong 1-hour candle close holding above $281.65, the initial upside target rests at $282.95, matching local VWAP (Volume Weighted Average Price) and minor consolidation barriers. A high-volume expansion past this initial node will likely activate momentum algorithms, accelerating the price action toward the secondary target at $284.09, where a visible volume profile gap-fill begins. If macro yield pressures soften later in the week, a full bullish extension can target the major local supply ceiling at $287.29. This long setup is strictly conditional on defensive positioning; any daily close or sustained structural break below Friday's absolute low of $280.15 invalidates the bullish thesis, warning of further systemic downside.
$IWM Short Setup:
The technical bear case for $IWM gains massive structural validity if the index fails to sustain the $281.65 horizontal shelf on the morning tape. Given that small caps are leading the broader market lower under the weight of higher-for-longer monetary anxieties, any weak, low-volume bounces into localized resistance should be aggressively faded. The optimal tactical short trigger occurs on a clean breakdown beneath the immediate liquidity pocket at Friday's session low of $280.15, confirming that institutional distribution has not yet exhausted its selling pressure.
Once $280.15 is broken and successfully retested as intraday resistance, a rapid bearish expansion is anticipated. The first downside target sits immediately at $279.79, a key short-term psychological shelf. Continued downside momentum will expose a structural vacuum in the volume profile, paving a clear path to the secondary target at $277.65. If systematic selling cascades across the broader tape, look for a deep mean-reversion flush targeting major daily support nodes below this range. Conversely, if institutional buyers orchestrate a strong volume-backed push that reclaims and holds above $281.65, the bear case must be entirely abandoned to prevent exposure to a sudden short-squeeze.
$IWM Full Trading Plan & Execution Matrix (TL;DR)
The Long Execution Matrix
Tactical Entry & Support Pivot: Hold the $291.60 – $292.00 demand cluster and confirm a clean reclaim/acceptance above VWAP at $293.40.
Primary Upside Targets: $294.60 (Intraday Supply), $295.70 (Friday High), and $297.00 (Psychological Upper Extension).
Risk Management Invalidation: A decisive hourly close below the $291.60 pivot invalidates the bullish architecture.
The Short Execution Matrix
Bearish Fade Trigger: A high-volume breakdown and sustained acceptance below the $291.60 support floor.
Downside Profit Targets: $290.30 (Friday Low), $289.00 (Round-Number Magnet), and $287.20 (Structural 30m Support).
Risk Management Invalidation: A sharp reversal and breakout back above the $293.40 VWAP level, shifting control back to the bulls.
Strategic Bottom Line Due to the ongoing Russell Reconstitution, $IWM is currently a pure volume-driven vehicle. Treat $291.60 as the ultimate structural pivot for your entire game plan. If the index holds above this floor and clears the $293.40 VWAP marker, the path of least resistance points straight to the historical highs. Conversely, losing $291.60 opens up an immediate short-side trap door down to the $287.00 handle. Trade the clear structural triggers, manage your risk parameters around the index rebalance flows, and let the programmatic volume dictate your sizing.