
$IWM Stock Analysis: Critical $291.64 Pivot & Options Setup
Discover the critical $291.64 pivot level for $IWM. Get our full technical analysis, bullish & bearish price targets, and high-probability options plans.
STOCK ANALYSIS
$IWM Weekly Outlook: Critical $291.64 Pivot, Key Levels & Options Strategy
$IWM Weekly Outlook: Key Levels & Catalysts to Watch This Week
Small-cap stocks are entering a make-or-break trading window. The iShares Russell 2000 ETF ($IWM) is battling critical technical pivot points while bracing for major macroeconomic volatility, including the Federal Reserve's rate decision, Q2 GDP numbers, and inflation data.
Here are the core technical levels and catalysts every trader needs to watch for $IWM this week:
1. 🎯 Technical Setup: Inside Week Breakdown & Key Moving Averages
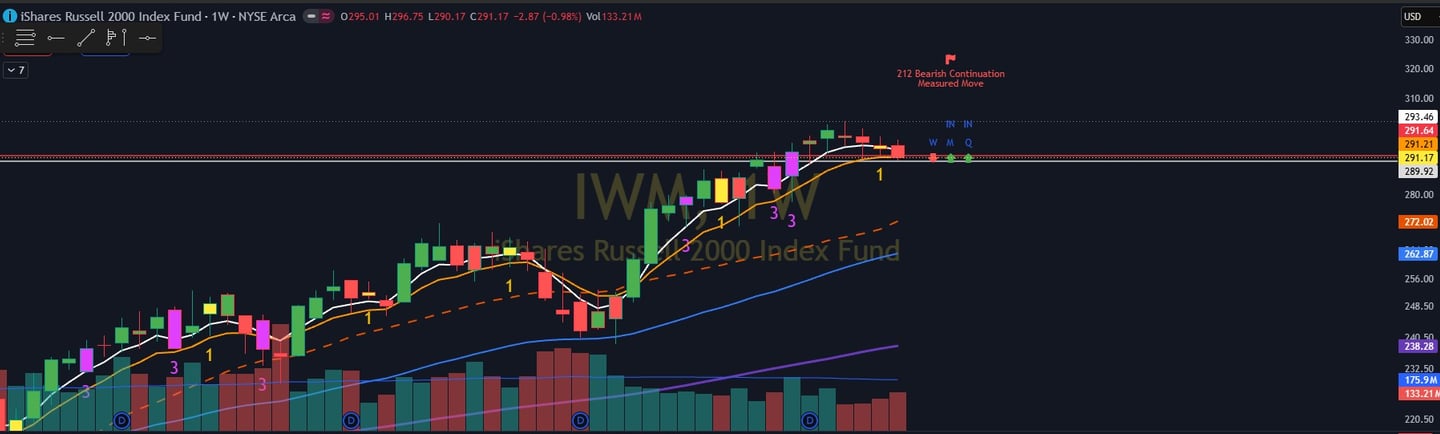
The immediate focus for $IWM traders rests on the recent technical breakdown below last week's consolidation range. How price reacts around key overhead resistance will dictate whether small caps bounce or slide into deeper support.
Pivot Resistance at $291.64: This level marks the critical break of the inside week low. If $291.64 acts as resistance on any retest, sellers remain firmly in control of the short-term trend.
Downside Target at $289.92 (50-Day MA): If $291.64 rejects price advances, the immediate downside target is the 50-day moving average at $289.92 on the daily chart. This level serves as the primary line in the sand for swing buyers looking to defend the broader uptrend.
Bullish Reclaim Scenario: A clean, high-volume daily close back above $291.64 invalidates the breakdown, opening the door for a push back toward recent range highs.
2. 🏛️ The Fed Rate Decision & Interest Rate Sensitivity:
Small caps remain far more sensitive to interest rate policy than S&P 500 giants. Roughly 30% of Russell 2000 debt is tied to floating interest rates, making Fed messaging critical for borrowing costs.
The Event: Federal Reserve Rate Decision & Policy Press Conference (Wednesday).
What to Watch: While benchmark rates are expected to remain steady, Fed Chair commentary regarding inflation trends and late-2026 rate-cut guidance will directly drive risk appetite.
Market Impact: Dovish rate guidance could provide the spark needed for $IWM to reclaim $291.64, whereas hawkish rhetoric increases the probability of testing the 50-day moving average at $289.92.
3. 📊 Macro Data: Advance GDP & Core PCE Inflation:
Beyond central bank policy, two top-tier macroeconomic reports will test domestic economic resilience this week:
Advance Q2 U.S. GDP (Thursday): Measures broader domestic growth health (consensus forecast ~2.3% annualized). Because small caps are domestically focused, strong GDP figures directly support $IWM earnings fundamentals.
June Core PCE Index (Friday): The Fed's preferred inflation gauge. A cooler-than-expected inflation print would ease pressure on small-cap financial, industrial, and consumer discretionary sectors.
⚔️ $IWM — Bulls vs. Bears
The Setup: Small caps broke below last week's consolidation range. The main battle line is drawn at $291.64 — pivot resistance from the inside week low. How price behaves at that exact level determines who controls the tape next.
📉 Bearish Path — 3 Downside Targets:
If $291.64 holds as resistance on any retest, sellers stay firmly in control. Here is where bears are pressing toward:
🎯 Target 1 — $289.92 (50-Day MA): The immediate price magnet. This is the primary line in the sand for swing buyers defending the broader uptrend. A clean break here flips the daily structure from consolidation to a deeper correction.
🎯 Target 2 — $287.50: The next major support shelf below the 50-day moving average. This level aligns with the lower boundary of the prior week's range. If the 50-day fails to hold price, this is where the next wave of buy-the-dip interest sits.
🎯 Target 3 — $284.80: Deeper structural support and the measured-move projection from the breakdown. Bears likely run out of steam here unless the daily trend has fully rolled over. A test of this level without a quick bounce signals a major regime shift for small caps.
📈 Bullish Path — 3 Upside Targets:
A clean, high-volume daily close back above $291.64 completely invalidates the breakdown. From there, bulls have clear room to operate:
🚀 Target 1 — $293.20: The first overhead supply zone above the breakdown level. Price should chew through this quickly if the reclaim has real conviction. Hesitation here indicates the bounce is merely a lower-high retest, not a true reversal.
🚀 Target 2 — $295.40: Recent range highs. This is where the major battle takes place — reclaiming this level fully negates the breakdown and puts the prior consolidation range back in play from the top side.
🚀 Target 3 — $297.80: Key extension target above the consolidation range. This marks the upper boundary of the broader weekly structure. Reaching this level requires sustained buy-side volume and a broader risk-on rotation into small caps.
💡 The Bottom Line:
Everything pivots on $291.64. A rejection there opens the $289.92 → $287.50 → $284.80 downside route. A high-volume reclaim unlocks the $293.20 → $295.40 → $297.80 upside path. React to price action at the pivot rather than predicting the outcome.
🎯 $IWM Options Plan & Trade Setups
Execution Note: Every trade setup below hinges on price behavior around the $291.64 pivot level. Always confirm volume and price action before entering, and respect stop-loss exits to maintain disciplined risk management.
🟢 Long (Bullish) Setups — Triggers on a Clean Daily Reclaim Above $291.64
📞 Buy the $292 Call (At-The-Money Momentum Play)
Setup: Enter once the $291.64 reclaim is confirmed with intraday buying volume.
Target: Push toward $293.20.
Risk Management: Exit immediately if price falls back below $291.64 during the same session.
📞 Buy the $293 Call (Out-of-the-Money Leverage Play)
Setup: Enter if volume is strong on the reclaim and you prefer a lower-premium, higher-leverage contract.
Target: $295.40 (range high zone).
Risk Management: Exit if $293.20 rejects and rolls price back under the pivot.
📊 Buy the $295/$297 Call Vertical Spread (Defined-Risk Play)
Setup: Buy the $295 Call and sell the $297 Call against it to cap total cost and risk.
Target: $297.80 extension zone.
Best Used For: Traders looking for a lower-risk, defined-reward play who believe the bounce is real but want protection against volatility.
🔴 Short (Bearish) Setups — Triggers on a Rejection at $291.64:
📉 Buy the $291 Put (At-The-Money Breakdown Play)
Setup: Enter on a clear rejection at $291.64. This is the cleanest bearish setup since short-term momentum is already in your favor.
Target: $289.92 (50-Day Moving Average).
Risk Management: Exit if price reclaims $291.64 and holds above it.
📉 Buy the $289 Put (Out-of-the-Money Continuation Play)
Setup: Enter if the 50-day moving average fails to catch price on first touch and downside momentum accelerates.
Target: $287.50 support shelf.
Best Used For: Catching the secondary wave of selling with cheaper premiums and increased leverage.
🎟️ Buy the $285 Put (Deep OTM Measured-Move Target)
Setup: Treat this as an extended continuation play. Enter only if price has already broken $289.92 with heavy conviction and the daily structure has fully rolled over.
Target: $284.80 measured-move zone.
Risk Management: Lock in profits at or near the target zone; do not hold deep OTM puts through a relief bounce.
💡 Trader Summary: Match your contract strike to your specific target zone. Use $292 calls / $291 puts for tight pivot scalp plays, and utilize spreads or OTM contracts only when high-volume momentum confirms the larger directional move.
❓ Frequently Asked Questions: $IWM Weekly Outlook
1. What is the most critical technical level for $IWM this week?
The single most important level for the iShares Russell 2000 ETF ($IWM) is $291.64, which marks the break of the inside week low. This price serves as the core pivot level for the entire week:
Below $291.64: Sellers retain control and press toward lower support targets.
Above $291.64: A daily close back above this level invalidates the breakdown and unlocks a bullish reversal.
2. What are the downside price targets if $IWM gets rejected at $291.64?
If $291.64 acts as firm resistance on any retest, traders should watch three primary downside targets:
$289.92 (50-Day Moving Average): The immediate magnet and primary line in the sand for swing buyers.
$287.50: The lower boundary of the prior consolidation range.
$284.80: Deeper structural support and the measured-move projection from the breakdown.
3. What targets can $IWM reach if buyers reclaim $291.64?
A high-volume daily close above $291.64 negates the bearish breakdown and opens up three upside targets:
$293.20: The immediate overhead supply zone.
$295.40: The recent consolidation range highs.
$297.80: Key extension target at the upper boundary of the weekly structure.
4. Which options strategies work best for trading the $291.64 pivot?
Options traders can structure their trades depending on how price action behaves at the $291.64 level:
Bullish Setups (On Reclaim): Buy $292 Calls for an immediate momentum push to $293.20, or construct a $295/$297 Call Spread for a lower-risk, defined-reward swing play toward range highs.
Bearish Setups (On Rejection): Buy $291 Puts on a clear rejection at resistance to target the 50-day moving average ($289.92), or look at $289 Puts if downside momentum accelerates below the 50-day MA.
5. Why is the 50-day moving average ($289.92) so crucial for small caps right now?
The 50-day moving average at $289.92 serves as the primary trend-filter for $IWM on the daily timeframe. As long as price holds above this moving average, the broader intermediate uptrend remains intact. A clean daily breakdown below $289.92 shifts the macro structure from a simple consolidation to a broader market correction.