
Micron ($MU) Smashes $1,000: Full Weekly Chart Blueprint & Key Levels
$MU stock hits historic all-time highs. Discover the ultimate Micron trading playbook with $1,009.50 support entries and $1,046.97 breakout targets.
STOCK ANALYSISMOMENTUM STOCKSDAY TRADING
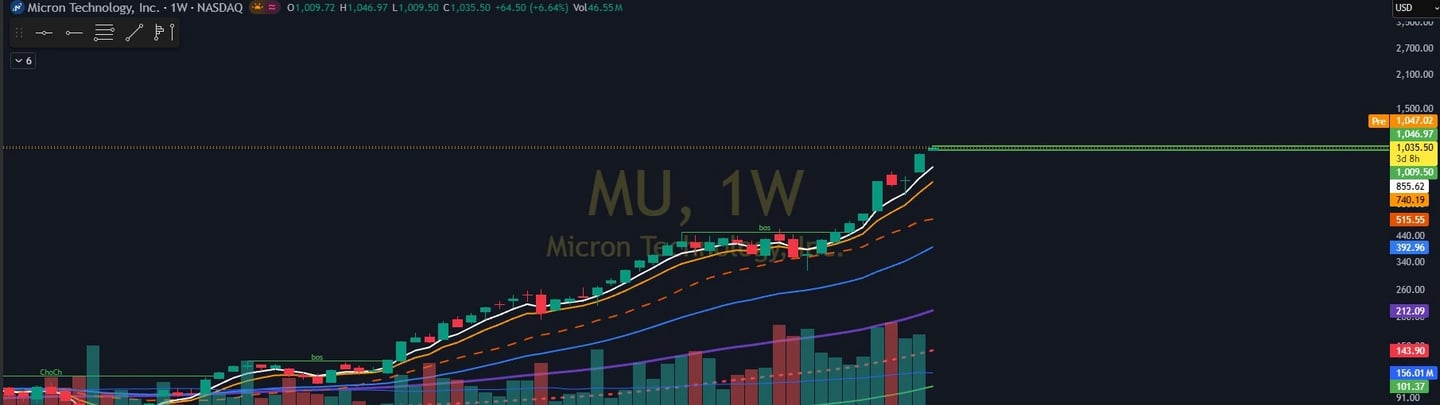
Table of Contents:
Why $MU is Trending Today:
The massive volume and historic price action driving Micron Technology are fueled by a perfect storm of Wall Street upgrades and an unyielding structural supply deficit in the AI infrastructure cycle.
The Massive Raymond James Upgrade: Just this week, Raymond James sent shockwaves through the market by aggressively raising its price target on $MU from $530.00 to a staggering $1,100.00, maintaining an Outperform rating. This massive institutional re-rating is forcing portfolio managers to chase shares to benchmark their tech exposure.
The Severe AI Memory Supply Crunch: High-performance artificial intelligence computing and data center deployments require unprecedented amounts of high-bandwidth memory (HBM). Industry capacity is almost completely locked up, causing memory chip pricing to skyrocket and enabling Micron to project a stunning run-up in sequential revenue.
The June 24 Earnings Blockbuster: Anticipation is reaching a fever pitch ahead of Micron's Fiscal Q3 2026 earnings release scheduled for Wednesday, June 24. Consensus estimates are projecting a massive 260%+ year-over-year revenue explosion to $33.8 billion. Traders are positioning heavily right now, building extreme liquidity across the options chain.
$MU Long Setup:
The macro weekly chart in image_57c48a.png shows that the bulls are in complete control of the broader trend. However, smart money enters on structural value, not at the peak of extensions.
The Pullback Support Targets: On any localized or broader market profit-taking, look for a constructive pullback into the $1,021.30 area or a deeper retest of the major historical pivot shelf at $1,009.50.
Order-Flow Confirmation: Watch for selling momentum to exhaust as price enters this zone. If buyers aggressively step in and defend these levels via bid-absorption or a sharp lower-tail candlestick on the intraday charts, the bullish continuation is verified.
Upside Price Targets: Once support holds, long configurations target an initial push back up to test the all-time high resistance point at $1,046.97. If the bulls flip $1,046.97 into a firm structural support floor, it opens the floodgates for a macro extension to test the psychological $1,128.51 target area
$MU Short Setup:
Despite the immense bullish tailwinds, memory stocks remain inherently cyclical, and automated trading algorithms will heavily punish the tape if buying exhaustion sets in near historical overhead resistance.
The Resistance Ceiling: Keep a laser focus on the daily price action around the $1,046.97 level. If the stock pushes into this zone during the morning session but experiences a hard denial, heavy tape rejection, or a rapid clustering of lower highs, the technical edge turns to the bears.
Execution Strategy: A clear rejection at $1,046.97 allows a high-R-multiple short position to be opened, risking tightly against session highs.
Downside Price Targets: The initial downside objective for this mean-reversion short trade is a retest of the immediate liquidity shelf at $1,009.50. If the $1,009.50 support structures completely break, panic-selling will likely accelerate a deeper flush down to the next macro gap-fill area at $982.82A
Disclaimer: This article is for informational and educational purposes only and is not financial advice. Always do your own research and manage risk carefully.
$MU Full Trading Plan TL;DR:
To copy and paste this quick-reference execution plan directly into your trading logs or active trading community feeds, use the scannable blueprint below:
Bullish Pullback Setup
Trigger Condition: Order-flow absorption / confirmed bounce within the $1,021.30 to $1,009.50 zone
First Target: $1,046.97 (All-Time High Retest)
Second Target: $1,128.51 (Macro Squeeze Extension)
Risk Management: Stop out on a clean structural break and hold below $1,000.00
Bearish Rejection Setup
Trigger Condition: Hard denial or aggressive seller rejection on a test of the $1,046.97 resistance ceiling
First Target: $1,009.50 (Immediate support shelf)
Second Target: $982.82 (Macro downside flush target)
Risk Management: Stop out immediately if the price clears and consolidates above $1,052.00
Trading Reminder: Trading four-digit stock prices requires precise share-sizing. Manage your risk tightly ahead of the June 24 earnings volatility, track the volume profile at the open, and always trade the reaction—not your bias!