
$QBTS Stock Price Prediction Today: Crucial $26.37 Level
$QBTS stock price surges on a major analyst upgrade. Discover the key $26.37 levels with our full long and short trading plan.
STOCK ANALYSISMOMENTUM STOCKSQUANTUM STOCKS
Why is $QBTS Trending Today?
D-Wave Quantum Inc. ($QBTS) is dominating order flow on the tape following its high-profile Analyst Day at the New York Stock Exchange. The stock experienced an explosive intraday rotation, surging over 12.5% on a massive volume injection of 44.7 million shares—exceeding its three-month average by more than 34%. The primary catalyst driving this institutional bid is a major upgrade from Mizuho Securities, which raised its price target on $QBTS from $29 to $35 while maintaining an Outperform rating, highlighting the company's commanding leadership in annealing quantum systems and its accelerated roadmap to deploy fault-tolerant gate-model architectures.
From a technical macro perspective, this volume-backed momentum builds on a larger secular tailwind. The Department of Commerce recently proposed a $100 million equity stake under the CHIPS and Science Act, anchoring $QBTS as a vital asset for national security and sovereign computing workloads. This massive public-private alignment has triggered a rapid delta squeeze in the option chains, shifting market maker hedging profiles to highly positive. As distribution algorithms battle to control inventory near the $26.37 level, a localized volatility pocket has formed, setting the stage for an aggressive directional breakout.
$QBTS Long Setup: What are the Key Breakout Levels?
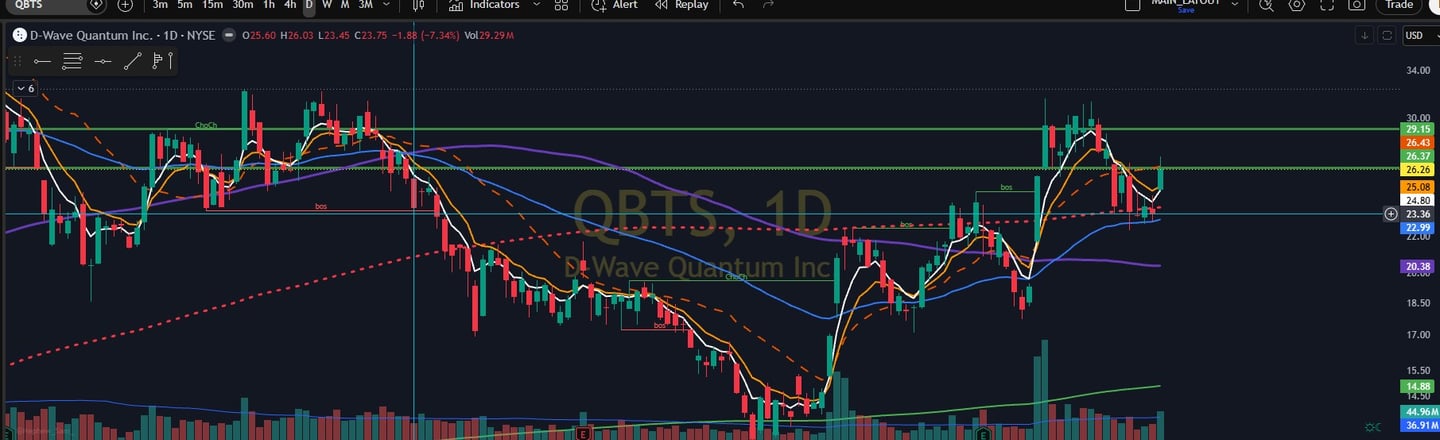
The immediate blueprint for a high-conviction bullish continuation requires a sustained reclaim and defense of the $26.37 macro line in the sand. Because price action is currently oscillating right at this critical threshold, chasing the tape without volume confirmation introduces severe execution friction. Long-focused desks must wait for a clean hourly close above $26.37, followed by a low-volume backtest that demonstrates institutional buy-side support stepping in to validate this area as a firm launchpad.
Once $26.37 transitions into verified support, the upward target progression is clear of immediate volume-profile barriers. The first technical objective rests at $27.15, aligning with the prior day's high where automated supply models previously distributed inventory. If momentum models trigger on a breakout past this zone, expect a fast continuation toward minor resistance at $31.30. A sustained squeeze through that level opens the runway for an aggressive test of $31.55, which represents the major swing high and the ultimate stretch target for this range.
$QBTS Short Setup: What are the Key Levels?
The bearish fade thesis becomes highly actionable if sell-side distribution algorithms successfully defend the overhead $26.37 pivot, keeping the bulls trapped in a negative gamma structure. If live order flow prints a clear tape rejection at the $26.37 level—characterized by a rapid decay in delta buying and an acceleration of offer-side volume—short-focused desks can initiate a high-probability mean-reversion trade targeting unhedged liquidity pockets below.
Once $26.37 is established as definitive resistance, the initial downside target maps directly to $24.91, representing the prior day's low and the first area of local liquidity. If sell-side pressure intensifies and breaks this structural node, price will immediately test nearby minor support at $24.78. In the event of a broader sector-wide liquidation, a break below this cluster exposes a wide volume-profile vacuum, paving the way for a rapid downside cascade toward major macro support at $22.49.
Disclaimer: This article is for informational and educational purposes only and is not financial advice. Always do your own research and manage risk carefully.
QBTS Full Trading Plan & Execution Matrix (TL;DR)
The Long Execution Matrix:
Tactical Entry & Support Pivot: Clean hourly reclaim and verified validation of the $26.37 pivot level.
Primary Breakout Targets: $27.15 (Prior Day High), $31.30 (Minor Resistance), $31.55 (Major Swing High / Stretch Target).
Risk Management Invalidation: An explicit hourly close or structural tape degradation below $26.37.
The Short Execution Matrix:
Bearish Fade Trigger: Clear volume-backed rejection or hourly breakdown beneath the $26.37 line in the sand.
Downside Profit Targets: $24.91 (Prior Day Low Area), $24.78 (Nearby Minor Support), $22.49 (Next Major Support).
Risk Management Invalidation: A decisive hourly reclaim and candle expansion back above $26.37.
Strategic Bottom Line:
The $26.37 macro pivot is the absolute gatekeeper for D-Wave Quantum's near-term directional bias, Tirthank. Above this key pivot, the tape is structurally positioned to squeeze trapped options writers toward the $31 range. If the tape fails to secure $26.37, avoid chasing the long side and instead prepare for a rapid rotation down to the $24.90 support cluster.