
$QUBT Stock Price Prediction Today: Crucial $11.00 Level
$QUBT stock price is trending ahead of major tech conferences. Can the quantum photonics play hold $11.00? Get our full long and short trading plan.
STOCK ANALYSISMOMENTUM STOCKSQUANTUM STOCKS
Why is $QUBT Trending Today?
Quantum Computing Inc. ($QUBT) has transformed into a high-velocity momentum vehicle on the back of major fundamental and institutional catalysts hitting the tape. Active market participants are aggressively positioning ahead of a packed macro schedule, with management slated to present at the Bank of America Transforming World Conference on June 16 and Benchmark's Quantum Computing Summit on June 17. Sentiment was sent into hyperdrive today following a major rating action from Ascendiant Capital, which reiterated its "Buy" rating and hiked its price target to $30.00 (up from $27.00). This endorsement follows the company’s landmark Q1 2026 earnings report, which showcased a structural paradigm shift in revenue—surging to $3.7M compared to just $39K in the prior-year period, validating their strategic integration of Luminar Semiconductor and NuCrypt to build out a dominant Thin-Film Lithium Niobate (TFLN) quantum photonics foundry.
From a structural micro-structure perspective, systematic order flow is tightly coiled. Option chains are exhibiting a highly bullish profile with an exceptionally compressed put/call ratio of 0.14, indicating that speculative retail desks and institutional market makers are heavily positioned in positive gamma configurations. As the broader market undergoes a powerful sector-wide rotation into quantum names—partially fueled by systemic capital flows anticipated from confidential OpenAI and SpaceX IPO filings—$QUBT has pinned itself directly against its $11.00 macro distribution anchor.
$QUBT Long Setup: What are the Key Breakout Levels?
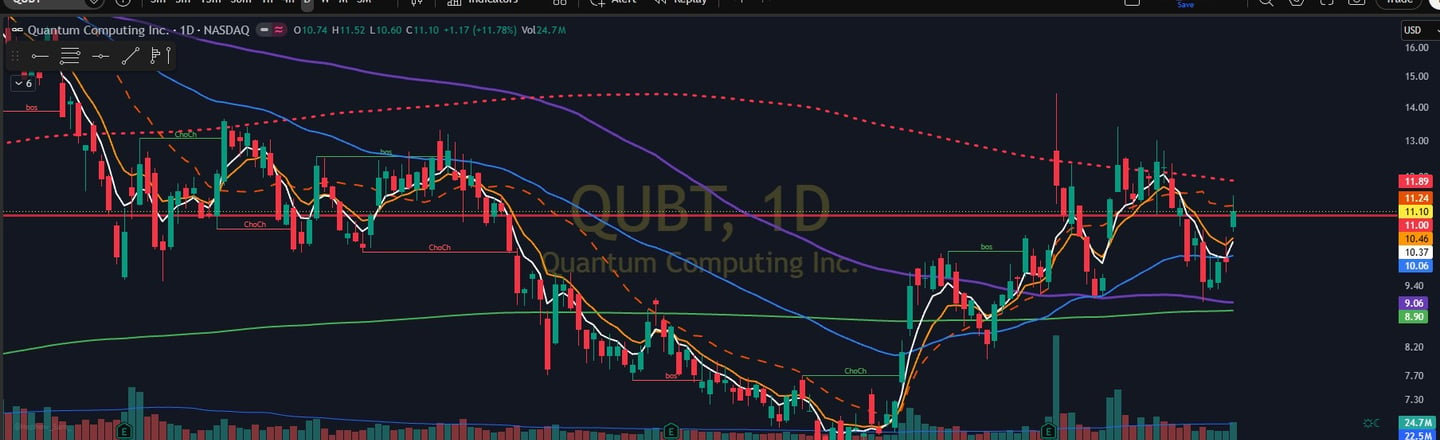
For long-side execution models to activate with institutional-grade probability, buyers must decisively reclaim and defend the $11.00 macro line in the sand. With price action currently battling for acceptance directly around this pivot, chasing the market marker delta without structural verification is a low-R:R setup. The tactical playbook requires waiting for live order flow to establish an hourly close above $11.00, accompanied by an expansion in buy-side volume profile momentum to verify that block buyers are actively absorbing overhead supply.
Once $11.00 shifts to a validated support floor, the upward expansion is positioned to clear a narrow intraday volume profile gap. The immediate upside objective is $11.36, today's high and the first clean line of intraday resistance. If momentum algorithms trigger a breakout above this level, expect a rapid delta squeeze toward minor daily resistance at $12.39, representing the consolidated close area from earlier in June. A clean capture of this cluster shifts the broader tape into a positive feedback loop, exposing the ultimate stretch target at $13.00, which marks the June 1 major swing high.
$QUBT Short Setup: What are the Key Levels?
The bearish fade thesis remains active if distribution algorithms successfully cap price expansion beneath the $11.00 structural pivot, trapping late-stage momentum buyers. If the order book shows sustained tape rejection at this line—evidenced by aggressive ask-side stacking and a rapid decay in call option volume—short-focused desks can initiate a high-probability mean-reversion trade targeting unhedged liquidity pockets down toward the mid-single digits.
A clean hourly loss of $11.00 serves as the primary bearish trigger. The initial downside target maps directly to $10.60, today's low and the first line of clean intraday support. If sell-side volume flows accelerate past this level, it will trigger algorithmic stop-outs, driving price through a minor liquidity gap toward $9.93—the June 12 close and the previous minor consolidation base. Below this base, the structural air pocket deepens, paving the way for a rapid capitulation drop to the next major multi-day breakout anchor at $9.32.
Disclaimer: This article is for informational and educational purposes only and is not financial advice. Always do your own research and manage risk carefully.
$QUBT Full Trading Plan & Execution Matrix (TL;DR)
The Long Execution Matrix:
Tactical Entry & Support Pivot: Clean hourly close and verified tape reclaim above the $11.00 macro anchor.
Primary Breakout Targets: $11.36 (Intraday High), $12.39 (June Consolidation Close), $13.00 (June 1 Swing High / Stretch Target).
Risk Management Invalidation: An explicit hourly close back below the $11.00 level.
The Short Execution Matrix:
Bearish Fade Trigger: Sustained volume rejection or clean hourly breakdown beneath the $11.00 line in the sand.
Downside Profit Targets: $10.60 (Today’s Low / First Support), $9.93 (Previous Consolidation Base), $9.32 (Major Breakout Base / Support).
Risk Management Invalidation: A decisive hourly reclaim and volume-backed breakout above the $11.00 level.
Strategic Bottom Line:
The $11.00 pivot is the absolute line in the sand for Quantum Computing Inc. ($QUBT). While the structural catalyst flow—anchored by Ascendiant's price target hike to $30—tilts the macro bias to the bull side, tape readers must demand price acceptance above $11.00 before initiating long exposure. A failure to hold this key pivot opens up a swift rotational unwind down to the $9.93 liquidity node.