
$RGTI Stock Outlook: Day Trading Strategy & Key Levels
Get the ultimate RGTI day trading playbook. Discover why Rigetti Computing is trending, explicit long/short entry triggers, and key support/resistance levels.
STOCK ANALYSISMOMENTUM STOCKSQUANTUM STOCKS
Why $RGTI is Trending:
Rigetti Computing Inc. ($RGTI) has solidified its position as one of the most volatile and heavily watched tickers in the quantum computing sector. With a surge in macro sector interest, massive relative trading volume, and key technical inflection points on the daily chart, active day traders are eyeing this equity for high-momentum scalps and intraday setups.
Whether you are looking to catch a breakout or time a reversal, playing the price action on Rigetti requires strict adherence to defined support and resistance targets. Below is a breakdown of exactly why the stock is moving, followed by the explicit long and short setups to trade for the upcoming sessions.
Government Contract Momentum: Quantum technology is moving from abstract speculation to tangible public sector infrastructure. Rigetti recently secured a vital $5.8 million, three-year contract with the U.S. Air Force Research Laboratory to develop hybrid superconducting-optical quantum network nodes. This follows news of a Letter of Intent with the U.S. Department of Commerce for up to $100 million in CHIPS Act funding, signaling deep fundamental backing.
Sector-Wide Volatility: Quantum peers like IONQ and QBTS are experiencing heavy social sentiment chatter, creating sympathy inflows that directly feed the liquidity pool of $RGTI.
Institutional Accumulation vs. Short Cover: Tradr ETFs recently expanded its high-leverage lineup, introducing leveraged quantum products that include exposure to Rigetti. This structural change, paired with institutional position adjustments from funds like Two Sigma and UBS Group, has significantly accelerated intraday volatility and volume.
$RTGI Long Setup:
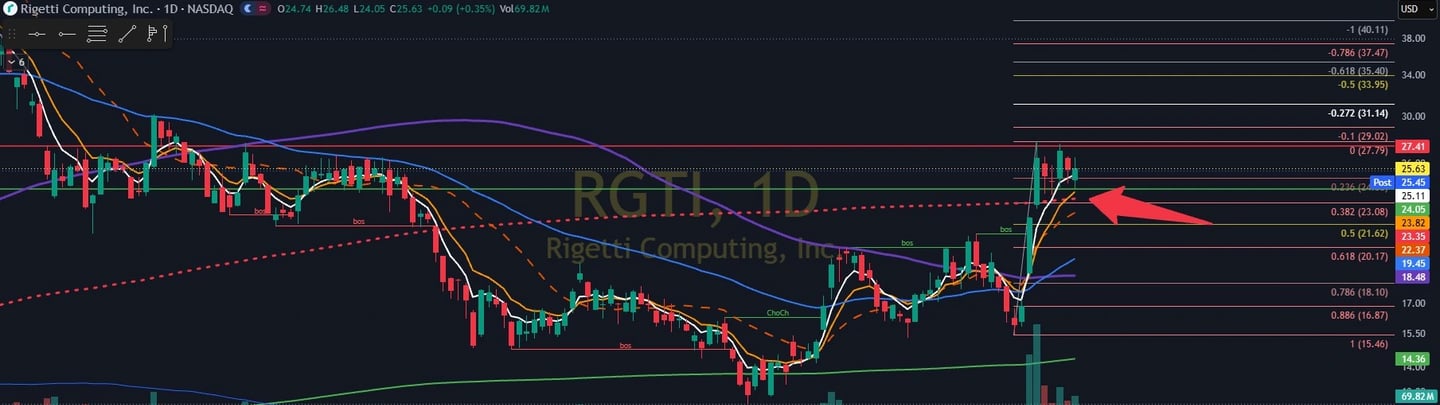
The Primary Trigger: If the ticker experiences a market open pullback, we are watching the major inflection point at $24.86.
Execution Validation: For an optimal entry, look for a decelerating tape or an immediate buyer response to hold the line at the $24.86 support on the 5-minute or 15-minute chart.
Upside Targets: Once support is verified, we scale into a long position to test initial resistance at $25.54. A clean breakout and hold above this zone opens up sequential targets at $26.56 and a final extensions stretch into $27.75.
$RGTI Short Setup:
The Primary Trigger: If the market experiences a morning pump, look for a fast push directly at the opening bell into key psychological overhead supply zones.
Execution Validation: Watch the $26.56 or $27.75 resistance bands. If aggressive sellers step in, volume spikes on red candles, or we see a failed breakout pattern (shooting star candle structure), look to execute a short position.
Downside Targets: Upon confirmation of a firm rejection, the primary downside breakdown targets sit at $25.54 and $24.86. If heavy selling momentum distribution accelerates past support, the trade has the legs to drop down toward the secondary target of $23.40.
Disclaimer: This article is for informational and educational purposes only and is not financial advice. Always do your own research and manage risk carefully.
$RGTI Full Trading Plan TL;DR:
Quick Read Playbook:
The Line in the Sand (Support): $24.86.
Long Bias Targets: Move long on a confirmed bounce off support.
Targets: $25.54, $26.56, $27.75.
Short Bias Targets: If price fails or rejects at $26.56 or $27.75, enter short back down to $25.54, $24.86, $23.40.