
Support and Resistance Trading: Complete 2026 Guide
Master how to map support and resistance levels. Learn to use indicators on TradingView and NinjaTrader 8, and execute advanced price action strategies.
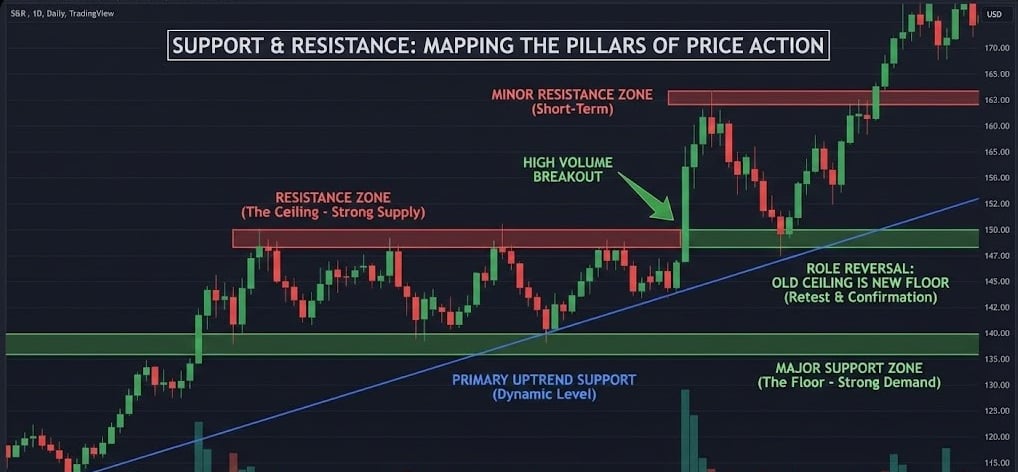
To build a flawless technical analysis foundation, a trader must look past the basic definition of support and resistance lines. Retail textbooks teach that these are simple lines on a chart where price magically stops and reverses. Institutional day and swing traders understand that support and resistance are actually dynamic, horizontal zones representing massive concentrations of resting order flow on the exchange ledger.
The Psychology of Supply and Demand Zones:
Every price chart is a map of human emotion and institutional execution. Their are two distinct psychological barriers:
Support Levels (The Demand Floor): Support is a specific price zone where buying interest completely overcomes selling pressure. When an asset drops to a major support level, institutions view the asset as undervalued and step in with heavy buy limit orders. Simultaneously, short-sellers who sold at higher prices begin buying shares back to cover their positions and lock in profits. This convergence of buying power stops the decline and drives the price upward.
Resistance Levels (The Supply Ceiling): Resistance is the exact inverse. It represents a price zone where selling interest overpowers buying momentum. As price rallies into a known resistance ceiling, long-position holders liquidate to secure gains, while contrarian short-sellers deploy massive institutional sell orders, creating an immediate supply overhang that pushes the price back down.
The Phenomenon of Role Reversal (The Flip):
One of the most reliable price action patterns occurs when a major support or resistance level is cleanly broken. Once broken, the structural identity of the level flips entirely.
When a stock breaks down below a key support line, that line automatically transforms into new resistance on any subsequent pullback. This happens because institutional traders who bought the asset at support are now trapped in losing positions. The moment the market bounces back up to that original entry level, these trapped traders scramble to sell and exit their positions at break-even. This sudden influx of forced selling capital firmly cements the old support line as a heavy new resistance barrier.
Support and Resistance Levels and Lines: Deconstructing the Core Mechanics
While manually plotting lines using swing highs and swing lows is a critical skill, it can introduce personal bias into your technical analysis. To ensure 100% objective execution during fast-moving trading sessions, professional traders utilize specialized support and resistance indicators to automate the mapping of key order blocks across platforms like TradingView and NinjaTrader 8.
Selecting the Right Indicator Framework:
When configuring a support and resistance indicator, you must avoid scripts that overcomplicate your workspace with a cluttered "spaghetti" of meaningless lines. Look for indicators that rely on pure mathematical algorithms:
Pivot Points (Standard & Fibonacci): This framework utilizes a mathematical formula based on the previous session's high, low, and closing price. It automatically plots clear daily, weekly, or monthly support (S1, S2, S3) and resistance (R1, R2, R3) zones. Because millions of institutional algorithms utilize these exact coordinates, these levels act as self-fulfilling price barriers.
Auto-S&R Based on ZigZag Fractal Breaks: Available natively on TradingView and via custom scripts on NinjaTrader 8, this indicator tracks structural market pivots. It draws a horizontal line only when a price wick cleanly breaks a previous major swing high or low, highlighting true market-structure shifts completely devoid of emotional bias.
Dynamic Volumetric S/R: The Volume Profile Anchor:
To achieve absolute elite charting accuracy, your primary support and resistance indicator should incorporate volume-at-price metrics.
By applying the Session Volume Profile or Anchored Volume Profile on TradingView or NinjaTrader 8, the indicator will plot horizontal nodes mapping out exact transaction clusters. The Value Area High (VAH) and Value Area Low (VAL) calculated by these indicators serve as highly accurate, dynamic support and resistance boundaries. Because these zones are backed by actual shares traded rather than just arbitrary price touches, they provide a significantly higher win rate when timing entries.
Automating Your Chart: Utilizing a Support and Resistance Indicator on TradingView and NinjaTrader 8
Once your support and resistance levels are properly mapped, tactical execution relies on exploiting the retail traders who place their stop-losses predictably right outside of those boundaries. The most profitable advanced strategy is the Liquidity Sweep, also known as the institutional stop-hunt or "fakeout."
The Anatomy of an Institutional Liquidity Sweep:
Hedge funds and market makers require immense liquidity to fill their massive block orders without moving the market against themselves. To find this liquidity, they look at obvious support and resistance lines where retail stop-loss orders are heavily concentrated.
During a bullish liquidity sweep, the price will aggressively sell off and pierce right through a well-known horizontal support line. Retail traders see the breakdown, panic, and sell their positions. At the exact same time, momentum traders enter fresh short positions. This triggers an avalanche of market sell orders. The institutions use this massive pool of forced selling liquidity to quietly buy millions of shares at a deep discount, rapidly absorbing the supply and forcing the price to instantly snap back above the support level.
The Execution Blueprint and Risk Management:
To trade the support and resistance liquidity sweep safely, you must wait for the fakeout to be mathematically confirmed on your chart:
The Level Setup: Map a clean, clear daily or 4-hour horizontal support zone that has been successfully tested at least twice.
The Sweep Phase: Wait for a rapid, high-volume intraday candlestick to drop completely below the support line, cleaning out the stop-loss orders.
The Trigger: Do not buy while the price is below the level. Wait for the candlestick to close. If the body of the candle recovers and closes cleanly back above the horizontal support line, leaving a long downside wick (rejection tail) behind, your trade trigger is live.
The Trade Entry: Enter a long position immediately at the open of the very next candlestick.
Risk Mitigation: Place your hard stop-loss precisely 1 to 2 ticks beneath the absolute lowest point of the rejection wick that swept the liquidity. Set your primary profit target at the opposing major resistance line across the trading range. This creates a highly asymmetric trade structure where you risk a minor distance to capture a full, high-velocity range rotation.