
$TBPH Stock Analysis: Critical $16.30 Pivot & Short Squeeze Targets
Full $TBPH stock analysis detailing the critical $16.30 pivot level, trade execution setup, and short squeeze price targets up to $19.50.
STOCK ANALYSIS
$TBPH Stock Analysis: Critical $16.30 Pivot & Short Squeeze Targets
🔥 Why Theravance Biopharma ($TBPH) Is Trending as a Short Squeeze Play
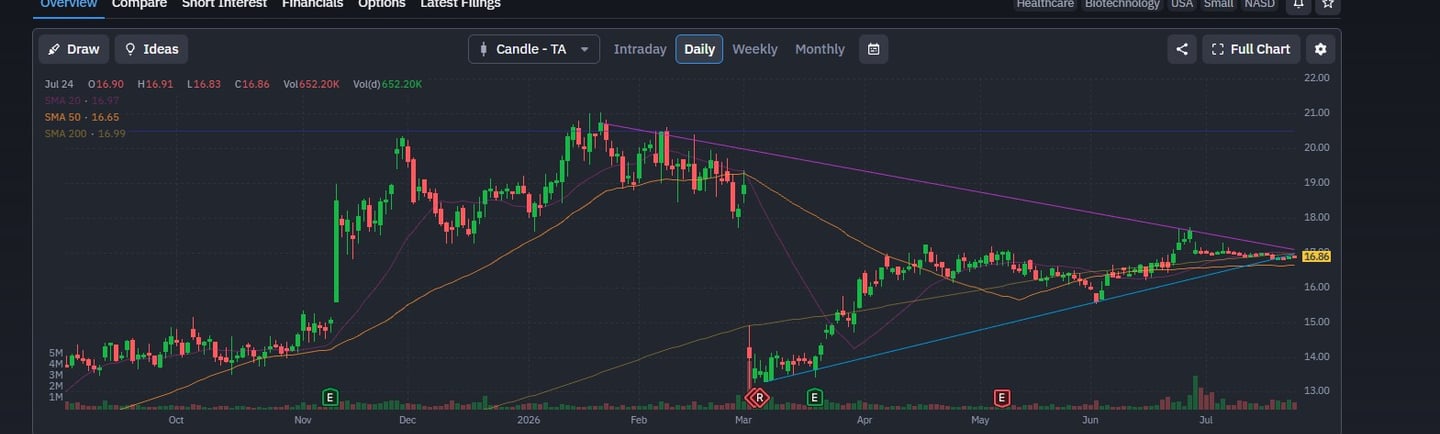
Theravance Biopharma ($TBPH) has emerged as a prime short squeeze candidate due to extreme price compression and a multi-month technical coil on the daily chart. Trading right around $16.86, $TBPH is trapped inside a tightening wedge pattern where a major volatility expansion is imminent.
Here are the key technical drivers causing $TBPH to trend among short squeeze traders:
📐 Massive Symmetrical Wedge Compression: On the daily chart, $TBPH has been forming higher lows off its March support level while making lower highs from its earlier peaks. Price action has coiled tightly into the apex of this wedge near $17.00, signaling that buyers and sellers are reaching a decisive tipping point.
🎯 Triple Moving Average Convergence: The 20-day SMA ($16.97), 50-day SMA ($16.65), and 200-day SMA ($16.99) have all converged into a tight 34-cent price band. When short-term, medium-term, and long-term moving averages pinch this tightly, it indicates extreme energy compression preceding a directional breakout.
💥 Coiled Volatility Potential: As trading volume dries up inside the apex, short sellers are pushed into a narrow range. A high-volume push above the converging 200-day SMA ($16.99) and descending trendline resistance can force a rapid short-covering rally as stops get triggered above $17.00.
$TBPH — Bulls vs Bears Full Trading Plan
The Setup: TBPH closed Friday at $16.86, sitting just above its 20-day EMA ($16.88) and holding above the 50-day SMA ($16.65). RSI is neutral at 50.4 — no extreme in either direction. The stock has been grinding in a tight range between $16.60 and $17.00 for weeks, with heavy touches at $16.60 (13 touches) and $16.98 (15 touches). This is a coiled spring. The key level everything hinges on is $16.30.
Why $16.30 matters: This level sits below the 50-day SMA ($16.65) and below the recent swing low structure ($16.80). It's the line in the sand that keeps the daily chart intact. Hold $16.30 and the setup stays constructive — the coil builds pressure. Lose $16.30 and the floor opens up toward the period low at $14.70.
Bearish Path — If $16.30 Fails:
If price breaks and closes below $16.30 on volume, the daily structure rolls over. Sellers take control and the following levels come into play:
$15.80 — First downside magnet. This is the measured move from a $16.30 breakdown. Expect initial buy-side interest here as dip buyers test the waters, but if $16.30 is already lost, this is likely just a speed bump.
$15.20 — Deeper support and the next structural shelf. Price tagged $14.70 as the period low, so this zone is where the last real defense sits before testing that low. If bears push price here without a meaningful bounce, the trend has fully shifted.
$14.70 — Period low. This is the ultimate bearish target. A clean break below $16.30 that reaches this level without a relief rally confirms a full trend change on the daily chart.
Bullish Path — 3 Regular Targets (If $16.30 Holds):
As long as $16.30 holds, the coil stays intact. Price is compressing between major resistance at $16.98 and support below. A breakout above $16.98 with volume unlocks the following regular targets:
Target 1 — $17.20: First profit target above the $16.98 resistance ceiling (15 touches). This is where the breakout confirms. Price should clear this level quickly if the move has real conviction. Hesitation here means the breakout is failing and $16.98 is still overhead supply.
Target 2 — $17.50: Mid-range extension. This sits between the current resistance zone and the period high. It's the natural profit-taking level for swing buyers who entered on the breakout. If price reaches here with strong volume, the trend is firmly bullish.
Target 3 — $17.74: Period high. This is the ceiling of the entire recent range. Reaching this level means the coil has fully unwound to the upside and the prior structure is completely negated. This is where regular target buyers should be fully out.
Squeeze Targets — 2 Aggressive Upside Projections:
This is the squeeze play setup to watch for. If TBPH breaks above $16.98 on high volume and clears $17.74 (the period high) without stalling, the coil has explosive potential. The tight range compression — weeks of chopping between $16.60 and $17.00 — means trapped shorts and sidelined buyers create fuel for a fast move. Here are the two squeeze targets:
Squeeze Target 1 — $18.50: This is the first extension above the period high. Once $17.74 is taken out, there's no overhead resistance structure until this zone. The move from $17.74 to $18.50 would represent a roughly 4% extension — fast and violent if the squeeze triggers. This is where the initial short-covering momentum exhausts its first leg.
Squeeze Target 2 — $19.50: Full squeeze projection. This is the measured-move target from the base pattern — the distance from the coil low ($16.60) projected upward from the breakout point ($17.00) yields approximately $19.60. Round to $19.50 as the second squeeze target. Reaching this level requires sustained volume, a broader sector tailwind, and no immediate reversal back below $17.74. If price gets here, the squeeze is real — not a head fake.
The Watch:
The trade is simple in structure but requires patience. $16.30 is the invalidation level. Above that, the coil builds. A breakout above $16.98 on volume is the trigger. Regular targets scale out at $17.20, $17.50, and $17.74. If the squeeze confirms above $17.74, let a runner work toward $18.50 and $19.50. If $16.30 breaks, flip bearish and target $15.80 → $15.20 → $14.70.
The RSI at 50.4 confirms there's no fuel burned in either direction. The coil is loaded. The breakout direction determines who wins.
❓ Frequently Asked Questions: $TBPH Squeeze Trading Plan
1. What is the current technical setup for Theravance Biopharma ($TBPH)?
Theravance Biopharma ($TBPH) closed Friday at $16.86, sitting right around its 20-day EMA ($16.88) and holding above its 50-day SMA ($16.65).
📐 Tight Consolidation: The stock has been coiling in a narrow range between $16.60 (13 touches) and $16.98 (15 touches).
⚡ Neutral Momentum: The Relative Strength Index (RSI) sits at 50.4, indicating momentum is entirely neutral with no fuel burned in either direction—creating a classic "coiled spring" setup.
2. Why is $16.30 the most critical level for$TBPH?
The $16.30 price level is the absolute line in the sand for swing traders because it sits beneath both the 50-day SMA ($16.65) and the recent market structure swing low at $16.80.
Holding $16.30: Keeps the bullish coil constructive and continues building pressure for an upside breakout.
Losing $16.30: Invalidates the bullish setup, breaks the daily structure, and opens up the floor for a deeper bearish trend shift.
3. What are the downside price targets if $16.30 fails?
If $TBPH breaks and closes below $16.30 on high volume, sellers take control, bringing three specific downside targets into play:
📉 Target 1 — $15.80: The initial downside magnet and measured-move target from the $16.30 breakdown.
📉 Target 2 — $15.20: Deeper structural support representing the final major defensive zone before retesting the period low.
📉 Target 3 — $14.70: The period low and ultimate bearish target. Reaching this level confirms a full trend reversal on the daily timeframe.
4. What are the regular upside targets if $TBPH breaks above $16.98?
As long as $16.30 holds, a volume-backed breakout above the $16.98 resistance ceiling (15 touches) unlocks three standard profit targets:
🎯 Target 1 — $17.20: Initial profit target just above resistance ceiling where the breakout confirms conviction.
🎯 Target 2 — $17.50: Mid-range extension level between resistance and the period high; ideal for scaling out swing profits.
🎯 Target 3 — $17.74: The period high and ceiling of the recent multi-week structure.
5. How high could $TBPH go if a short squeeze triggers?
If $TBPH clears $17.74 (the period high) on heavy volume without stalling, trapped short sellers and sidelined momentum buyers could trigger a fast short squeeze into two aggressive upside projections:
🚀 Squeeze Target 1 — $18.50: The first major extension zone above the period high (~4% move), where initial short-covering momentum typically exhausts its first leg.
🚀 Squeeze Target 2 — $19.50: Full base-pattern measured-move projection (calculated by projecting the distance between the $16.60 coil low and the $17.00 breakout point upward).
6. What is the recommended execution strategy for this trade setup?
The strategy relies on patience and strict level execution
🛡️ Invalidation / Stop Loss: $16.30 is your line in the sand.
🔑 Breakout Trigger: A high-volume move above $16.98.
💰 Profit Taking: Scale out regular targets at $17.20, $17.50, and $17.74. If the squeeze confirms above $17.74, leave a runner to trail toward $18.50 and $19.50.