
T1 Energy ($TE) Breakout Analysis: Key Levels as Stock Tests 52-Week Highs
$TE stock is surging on record volume. Discover the ultimate T1 Energy trading playbook with $10.00 support entries and $10.60 short trigger targets.
STOCK ANALYSISMOMENTUM STOCKSTECHNICAL ANALYSIS
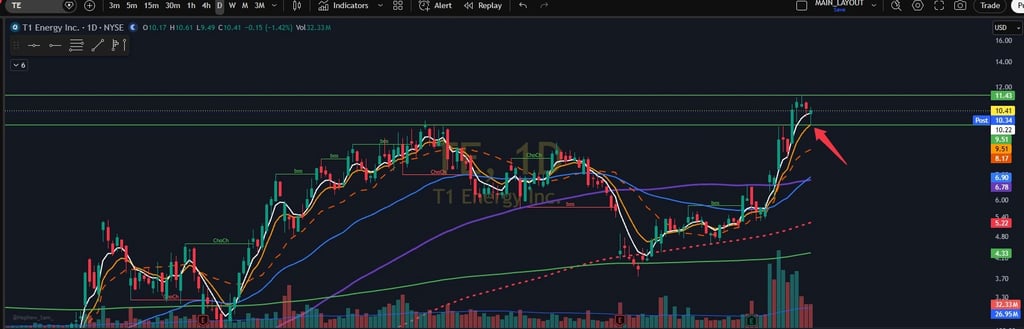
TABLE OF CONTENTS:
Why $TE is Trending Today:
T1 Energy Inc. ($TE) has captured the full attention of momentum traders and institutional algorithms alike. As seen on the daily chart, the stock has printed a vertical technical breakout, clearing past multi-month resistance levels and testing an explicit 52-week high of $11.43.
The volume profile confirms that this move is backed by real institutional capital, completely altering the stock’s macro structure. However, chasing a stock after a multi-dollar, vertical expansion is a high-risk endeavor. To trade $TE safely this week, you must let the key intraday levels establish themselves. Here is the comprehensive breakdown of the long and short execution plans.
The explosive daily momentum in T1 Energy is being fueled by a powerful convergence of fundamental turnaround data, heavy institutional accumulation, and an upcoming corporate corporate showdown.
Record Q1 Earnings Momentum: The foundation for this massive technical re-rating was laid by T1 Energy's Q1 2026 earnings statement. The company posted a record quarterly adjusted EBITDA of $9.1 million, with gross margins widening significantly by 10% quarter-over-quarter to reach 17%. This margin expansion proved to Wall Street that their solar module and clean energy platform is scaling into profitability.
A Tidal Wave of Smart Money: Large-scale hedge funds have aggressively rotated into the ticker. RenTech (Renaissance Technologies) and Two Sigma Investments heavily expanded their positions in $TE during the first half of the year, creating a persistent structural bid beneath the shares.
The June 17 Authorized Share Conflict: While the tape is heavily bullish, a major corporate catalyst is looming on June 17, 2026. T1 Energy is seeking shareholder approval to double its authorized common stock from 500 million to 1 billion shares. While this provides capital-raising flexibility for future manufacturing scale, it introduces dilution concerns. Compounding this, recent SEC Form 144 filings revealed a major insider sale of over 260,000 shares by executive Einar G. Kilde, putting short-sellers on alert for potential profit-taking.
$TE Long Setup:
With the macro daily trend firmly pointing upward, the highest-probability setups for retail traders will be "buy the dip" opportunities at established support boundaries. The chart shows the white short-term exponential moving average (EMA) rapidly curling up to meet price action right around the psychological double-digit mark.
The Pullback Target Area: Do not buy the top of the daily candles. Instead, patiently watch for a structural pullback into the $10.00 psychological floor, or a deeper flush down into the $9.50 horizontal value pocket.
Order Flow Confirmation: To validate an entry, you must see selling volume dry up on the tape as price approaches these zones. Wait for clear signs of institutional buyers stepping back in to defend the levels via aggressive bid-absorption or a strong 15-minute reversal candle.
Upside Price Targets: Once support is verified, long positions can be added or scaled into, targeting a multi-stage upside continuation. The first pocket of minor overhead supply sits at $10.60. Clearing that level opens the door to $11.00, with a macro expansion target aimed precisely at the 52-week high of $11.43.
$TE Short Setup:
Given how quickly $TE has expanded over the past month, any sudden macro headwinds, broader market liquidity drains, or fears regarding the upcoming share dilution vote could trigger a rapid wave of profit-taking. If the bulls fail to hold the line at local resistance, a highly lucrative mean-reversion short trade presents itself.
The Resistance Ceiling: Keep a very close eye on the intraday price action around the $10.60 pivot level. If the stock attempts to bounce during morning trading but repeatedly prints lower highs or experiences hard tape denials / aggressive seller rejections at $10.60, the technical bias shifts to the bears.
Execution Strategy: A confirmed rejection at $10.60 serves as a high-R-multiple short trigger, allowing you to risk against the session highs.
Downside Targets: The primary downside target for this short setup is a retest of the immediate liquidity shelf at $9.50. If the $9.50 support structures completely break, panic-selling will likely accelerate a deeper flush down to the macro gap-fill area at $8.70.
$TE Full Trading Plan TL;DR:
Bullish Pullback Setup
Trigger Condition: Order-flow absorption / confirmed bounce within the $10.00 to $9.50 support zone
First Target: $10.60
Second Target: $11.00
Final Target: $11.43 (Macro 52-week high breakout)
Risk Management: Strict stop-loss on a definitive daily close below $9.40.
Bearish Rejection Setup
Trigger Condition: Hard denial or aggressive seller rejection on any bounces into $10.60 resistance.
First Target: $9.50 (Immediate support retest)
Second Target: $8.70 (Deep macro flush target)
Risk Management: Stop out immediately if price clears and consolidates above $10.75.
Trading Reminder: Volume dictates direction. Ensure you are monitoring the relative volume (RVOL) at the opening bell. Manage your risk tightly ahead of the June corporate catalysts, and trade the reaction—not your bias!