
$IBM Stock Crash: Why It Plunged 25% & Full Trading Plan
IBM stock just crashed 25% on a surprise preliminary Q2 miss. Discover the key institutional support levels to watch and get the exact long/short trading plan.
STOCK ANALYSIS
Inside the $IBM Liquidation: Is This 25% Crash a Value Trap or the Ultimate Buy Opportunity?
Why $IBM is Sinking: The Surprise Premarket Liquidation
A Blue-Chip Anchor Facing Unprecedented Premarket Volatility:
When a multi-billion-dollar technology anchor like International Business Machines ($IBM) drops double digits in a single premarket session, the entire financial market stops to look. This morning, the unthinkable happened for conservative tech investors: $IBM shares went into an absolute freefall, sliding between 14% and 17% before the opening bell even rang. For a blue-chip defensive giant that typically moves with the predictable stability of a regulated utility stock, a violent gap-down of this magnitude represents a massive institutional liquidation event.
This isn't your typical retail panic or minor algorithmic noise caused by thin early-morning trading volumes. A move this aggressive means major mutual funds, pension funds, and institutional desks are actively slamming the sell button to reset their exposure. Decades of market history show that when a legacy Dow Jones component experiences a multi-billion-dollar haircut in a matter of minutes, it signals a fundamental crack in the near-term bull thesis that capital allocators simply cannot ignore. Every day trader, swing trader, and dividend investor is hitting their screens right now with the exact same questions: What went wrong inside Big Blue, and where is the structural floor on this chart?
The Ripple Effect Across the Technology Sector:
The fallout from IBM's preliminary financial drop isn't contained to its own ticker tape. Because IBM is woven into the very fabric of global enterprise infrastructure, software architecture, and corporate IT consulting, its sudden drop is sending massive shockwaves throughout the entire technology sector. Trillions of dollars of institutional capital are suddenly re-evaluating risk across the board, and the damage is already tearing through enterprise software and consulting peers like ServiceNow, Salesforce, and Accenture in sympathy.
When a Goliath like IBM admits to a operational stumble, portfolio managers instantly assume that a broader enterprise spending slowdown is hitting the entire industry. This creates a cascading liquidity drag across tech ETFs, forcing automated systematic funds to trim positions regardless of individual company strength. For short-term traders, this sector-wide drag is pure rocket fuel. The massive surge in cross-market volatility breaks the normal daily ranges, creating highly exploitable, high-volume trading pockets across multiple tech equities simultaneously as the market scrambles to correctly price the structural damage.
Why This High-Velocity Breakdown Matters for Your Portfolio:
An institutional wipeout of this scale creates an incredibly lucrative environment for disciplined traders who know how to read between the lines. When a legacy stock gets pushed entirely outside its standard historical volatility bands, it strips away the day-to-day market noise and leaves us with pure, volume-backed price action. The traditional fundamentals momentarily take a backseat to raw supply and demand, setting up some of the highest-probability risk-to-reward structures you will see all month.
However, trying to trade a falling knife without a calculated roadmap is a fast track to account destruction. Whether you are looking to catch a generational bottom for a long-term position, hunt an overextended intraday dead-cat bounce, or scale into a short position on a weak relief rally, you cannot afford to trade this headline blindly. To survive a high-velocity breakdown like this, you have to separate the sensationalized financial media headlines from the raw corporate data, understand the precise catalyst behind the liquidation, and map out a bulletproof technical execution plan based on institutional levels.
The Underlying Catalyst: Mainframe Slumps and the AI Capex Shift
Deconstructing the Preliminary Q2 Revenue Miss:
To understand why the smart money yanked billions of dollars out of IBM in a matter of minutes, you have to look directly at the internal plumbing of their preliminary second-quarter financial release. The core headline that triggered the algorithmic sell programs was a definitive top-line revenue miss. IBM reported preliminary Q2 revenue of $17.2 billion, which fell noticeably short of Wall Street consensus expectations sitting at $17.86 billion.
While a top-line miss of a few hundred million dollars might seem like a minor speed bump for a smaller growth company, for an enterprise titan like IBM, it indicates a structural breakdown in quarterly execution. When you peel back the layers of the report, the real damage becomes clear. The primary culprit behind the shortfall was a painful 7% drop in IBM's core Infrastructure segment. This steep decline was driven by a sharp, unexpected slump in mainframe Z-system sales and the high-margin transaction processing software stack that accompanies them. Coupled with completely flat consulting revenue, the sudden deceleration in legacy infrastructure left a massive hole in IBM's quarterly balance sheet that its 5% software growth simply couldn't patch over.
The AI Capital Expenditure Pivot: Hardware vs. Software:
The most fascinating part of this story—and the macro narrative you need to understand as a trader—is why these budgets evaporated so quickly in June. IBM Chairman and CEO Arvind Krishna pointed out an aggressive, industry-wide shift in how major corporations allocated their capital expenditures as the quarter drew to a close. Instead of signing off on traditional multi-million-dollar enterprise software contracts or updating their legacy mainframes, corporate clients abruptly pivoted their cash toward raw physical hardware.
Corporate buyers went on an absolute spending spree for physical servers, storage units, and high-performance memory chips. This sudden hoarding behavior wasn't accidental; companies were actively trying to front-run severe global supply chain constraints and heavily anticipated tech hardware price hikes scheduled for the back half of the year. Because enterprise IT budgets aren't infinite, this emergency hardware hoarding completely cannibalized the capital that had originally been earmarked for IBM's software ecosystem and mainframe upgrades. Money that was supposed to land in IBM's pocket was redirected to secure physical infrastructure elsewhere, proving that even defensive tech giants aren't immune to sudden shifts in the broader artificial intelligence supply chain.
A Failure in Execution: The CEO's Candid Admission:
What truly intensified the institutional panic and converted a standard earnings miss into a historic premarket route was the absolute lack of corporate sugarcoating in the investor letter. In a rare display of corporate candor that sent risk management desks scrambling, CEO Arvind Krishna openly admitted that the company mismanaged the quarter's shifting landscape. He explicitly wrote to investors: "These conditions require our teams to execute perfectly, and this quarter we faltered."
When an institutional fund manager reads an explicit acknowledgment from a blue-chip CEO stating that their team "faltered," the response is almost always immediate liquidation. It confirms that multiple large-scale corporate deals completely slipped past their expected closing timelines and failed to cross the finish line before the quarter closed. This operational hiccup sparked an immediate crisis of confidence regarding near-term forward guidance. Institutional desks hate uncertainty more than anything else, and when execution stumbles, they sell first and ask questions later. This aggressive capital flight is exactly what created the massive volume spike and the clean, high-velocity price action we are looking to capitalize on today.
The Technical Blueprint: Reading the Damage on the Daily Chart
The Anatomy of a Massive Gap-Down and Institutional Volume Spike:
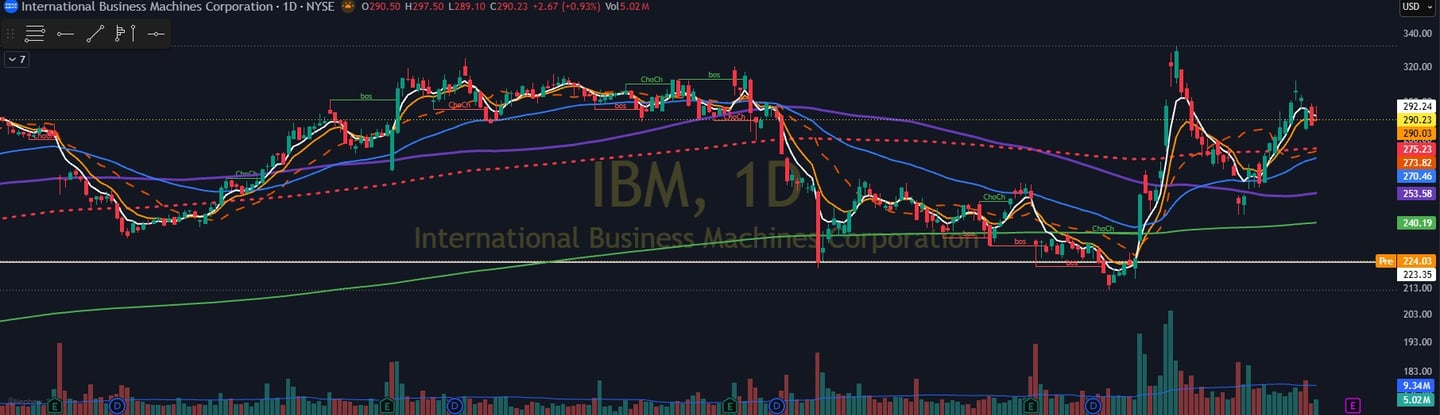
From a purely technical perspective, a 14% to 17% premarket gap-down completely rewrites the structural reality of the $IBM chart. In trading, gaps of this magnitude on massive, blue-chip equities are known as "breakaway gaps," and they permanently change the character of a stock's price action. When the opening bell rings and the chart leaves a massive, empty void between yesterday's closing price and today's opening print, it means every single trader who bought the stock over the past several months is instantly trapped underwater.
This creates an immediate psychological shift in the market. The massive blank space left on the daily chart now acts as an incredibly thick layer of overhead supply. Every trapped investor who is currently panicking is no longer looking to maximize profits; they are praying for a relief rally just so they can sell and break even. Furthermore, we must monitor the opening volume bars. A gap-down on thin volume can be brushed aside, but when institutional liquidation occurs, the volume bars will spike to multiples of the 30-day relative average. This massive volume confirm that the old bullish trend is officially dead, and a new, high-volatility trading range has begun.
Identifying Key Moving Averages and Historical Support Shelves:
When a structural anchor like IBM faces a severe selloff, you cannot rely on minor intraday support lines. You have to zoom out to the daily and weekly timeframes to find where the "smart money" handles major accumulation. The first major line in the sand for any long-term bull trend is the 200-day Simple Moving Average (SMA). To institutional portfolio managers, the 200-day SMA represents the ultimate dividing line between a healthy market correction and a true structural bear market. If the stock gaps directly into or slightly below this moving average, we expect an immediate battleground between automated liquidation algorithms and long-term value buyers.
Beyond the moving averages, your eyes must scan left on the chart to locate major multi-month consolidation shelves and previous gap-fill zones. We want to find the exact price levels where IBM spent weeks consolidating before its previous upward expansions. These historical consolidation floors represent areas of heavy institutional order blocks—places where major funds previously spent millions of dollars building their core positions. When price aggressively revisits these zones during a panic, those same institutions will often step back in to defend their average cost basis, creating a highly reliable, high-probability bounce zone for short-term traders.
Technical Indicators and Momentum Extremes: Navigating the Oversold Trap:
A sudden, violent drop will instantly flush short-term momentum indicators into historic extremes. When you plot the Relative Strength Index (RSI) on the daily chart, a drop of this velocity will inevitably drag the metric deep into oversold territory, frequently plunging well below the standard 30 line and into the teens. For amateur traders, seeing an extreme oversold reading creates an immediate temptation to blindly buy the stock, operating under the flawed assumption that because a stock has fallen so far, it has to bounce.
In high-velocity institutional liquidations, "oversold" can quickly become "more oversold." The RSI can stay pinned at the bottom of its gauge for days while a stock continues to bleed out. Instead of treating an oversold indicator as a green light to buy, professional traders view it as a warning sign that the selling pressure is reaching an exhaustion point. The true value of an oversold RSI is that it flags a coiled spring setup. When the selling volume finally slows down and the price action stabilizes near a major historical support shelf, that extreme momentum readings tells us that any short-covering bounce will be incredibly fast and explosive—setting up a premier intraday long opportunity for those patient enough to wait for the confirmation candle.
Disclaimer: This article is for informational and educational purposes only and is not financial advice. Always do your own research and manage risk carefully.
The Execution: Full Trading Plan for $IBM
The Bullish Mean-Reversion Strategy:
Because a 25% gap-down is an extreme reaction for a company still generating billions in free cash flow and experiencing double-digit growth in its core software divisions, a powerful mean-reversion bounce remains a highly distinct possibility. If the price action stabilizes above key structural levels on heavy buying volume, you can execute this long bias through two distinct pathways:
The Aggressive Support Entry (Scenario A): If opening volume indicates that the market is actively defending the immediate four-touch support shelf, establish a long position near the $225.00 zone. Place a strict technical stop below the period low at $210.00, exposing a total risk of $15.00 per share. Based on a disciplined $25,000 account size risking a maximum of 2% ($500 total risk), this permits a maximum position size of 33 shares, representing a total capital allocation of $7,425. Take profits methodically on the way up, scaling out a partial chunk at the $230.51 structural resistance shelf, exiting the bulk of the trade at the $243.68 minor resistance level, and leaving a small runner to test the major overhead resistance at $258.50.
The Conservative Period-Low Entry (Scenario B): For a more patient approach, wait for the market to completely flush out early sellers and test the true multi-month floor at $212.34. If buyers step in and construct a clean intraday reversal pattern, execute an entry near $213.00 with a tight protective stop placed just under the structure at $205.00. This tighter $8.00 risk per share allows you to safely increase your allocation to 62 shares ($13,206 position size) while maintaining the identical $500 maximum loss threshold. Your upside targets for this structure align at $224.90 for your first major partial exit, $230.51 for target two, and $243.68 to unlock maximum value on your final runner position.
The Bearish Follow-Through and Breakdown Strategy:
Earnings misses of this magnitude frequently invite persistent, follow-through institutional selling over the subsequent sessions. Given that the upcoming, full quarterly earnings call is still over a week away, a prolonged period of market uncertainty could easily cause the current support structures to snap. You can capitalize on this bearish continuation through two clear execution pathways:
Shorting the Failed Bounce (Scenario A): If an early relief rally drives the stock upward from the open but aggressively rejects and prints a lower-high pattern against the $230.51 resistance shelf, initiate a short position near $230.00. Place your protective stop above the minor resistance cluster at $244.00, risking $14.00 per share. Sizing this trade against your standard $500 risk profile yields a position of 35 shares, committing an $8,050 total capital allocation. Cover your short position and lock in profits at the $217.70 intraday gap low, take further partial gains at the $212.34 period low, and let a runner extend down toward the $205.00 macro extension floor.
Shorting the Momentum Breakdown (Scenario B): If the opening bell brings a wave of intense, high-volume selling that cleanly cracks straight through the four-touch support shelf, enter short on the breakdown at $224.00. Position your protective stop tightly above the broken structure at $231.00, risking exactly $7.00 per share. This refined technical risk allows you to scale into a larger allocation of 71 shares ($15,904 position size) while strictly respecting your $500 risk ceiling. Look to cover your position rapidly as momentum hits the lower targets, scaling out at the $217.70 gap low, taking partials at the $212.34 support shelf, and capturing the ultimate downside extension at $205.00.
Operational Rules for High-Velocity Volatility:
To guarantee clean execution and prevent getting caught on the wrong side of a erratic market whip, you must adhere to a strict set of operational guardrails. First, absolutely avoid entering trades during the pre-market hours; wait for the official opening bell and allow the first five to fifteen minutes of live market volume to settle wide spreads and establish an organic direction. Second, use the $224.90 major support level as your primary intraday pivot to dictate which plan to deploy. If the price holds above it on heavy buying volume, lean toward the long configurations; if it breaks below it on heavy selling volume, immediately pivot to the breakdown short strategy.
Always take half of your position off the table when price hits your first target, and instantly trail your protective stop to your breakeven entry point to guarantee a risk-free trade on the remaining runner. Finally, keep a close eye on the calendar. The upcoming full earnings report on July 22 represents a massive, binary risk that can cause the stock to violently gap an additional ten percent in either direction. Ensure that your short-term tactical positions are either entirely closed out or significantly reduced before that date arrives, allowing the charts, rather than emotion, to dictate your execution.