
$SLS Stock Trading Plan: Buyout Rumors & Key Levels To Watch
Sellas Life Sciences ($SLS) is exploding on buyout speculation. Discover the critical $9.84 must-hold level, long targets up to $15, and the full short setup.
STOCK ANALYSISMOMENTUM STOCKS
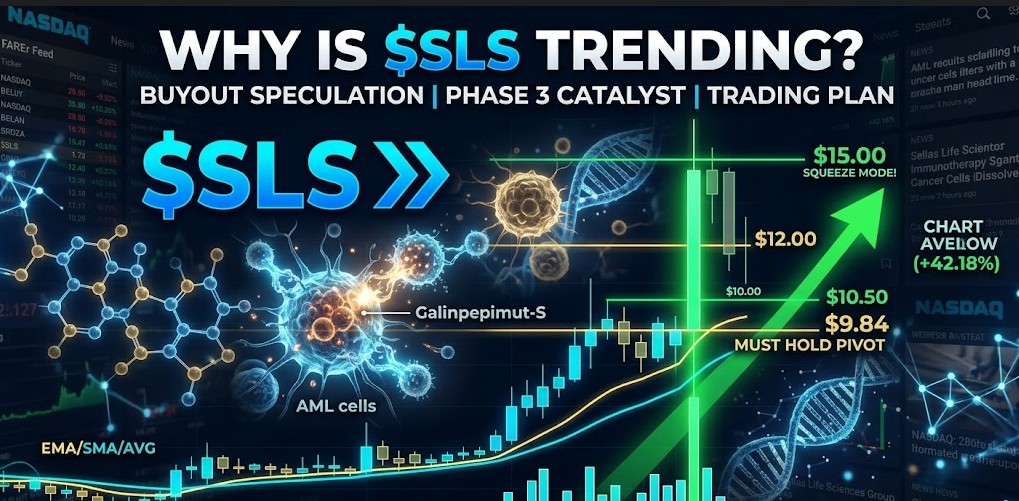
Why is $SLS Trending? Is a Buyout Imminent? Why Sellas Life Sciences ($SLS) is Ripping Right Now
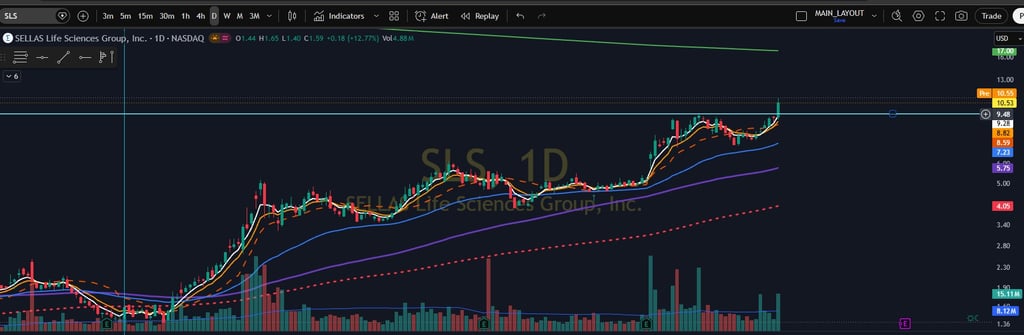
Biotech stocks are famous for massive, violent moves, but Sellas Life Sciences Group ($SLS) is capturing everyone’s attention this week. The stock just printed a massive green candle, surging nearly 13% in a single session on heavy volume.
If you’ve noticed $SLS blowing up your scanners or trending all over financial social media, you aren’t alone. Here is the exact breakdown of why this under-the-radar biotech ticker is suddenly red-hot, what the smart money is watching, and how to approach the chart.
The immediate match that lit a fire under $SLS is a brand-new SEC regulatory filing regarding executive compensation.
Sellas officially amended the employment and severance agreements for its top three executives, including President and CEO Dr. Angelos Stergiou, the CFO, and the Chief Development Officer. Crucially, the updates specifically alter their payouts during a "Change of Control" scenario—meaning a corporate acquisition or merger. Under the new terms, if the company is bought out, these executives will receive massive, accelerated lump-sum cash payouts and immediate vesting of their equity.
In the trading world, when a small-cap biotech company quietly restructures executive contracts to protect top leadership in the event of an acquisition, the market reads between the lines. Traders poured into the stock, betting heavily that these contract tweaks mean private equity or a larger pharmaceutical giant is actively kicking the tires on a buyout.
The Underlying Catalyst & Market Sentiment
While the corporate restructuring triggered the immediate spike, the real multi-million dollar story behind Sellas is its clinical pipeline. Everything hinges on their flagship asset: Galinpepimut-S (GPS), a targeted cancer immunotherapy designed to treat Acute Myeloid Leukemia (AML).
This isn't a long-term "maybe" project—the company is sitting right at the absolute finish line of its pivotal Phase 3 REGAL trial.
The Bull Case:
The trial is designed to automatically unblind and trigger a final data review once 80 "events" (patient deaths) occur. In their latest update, Sellas revealed that 78 out of the 80 required events have already happened. We are literally two events away from a massive, binary clinical trial readout that could fundamentally change AML treatment. Bulls believe the executive contract restructuring is proof that management already knows a larger player wants to buy the company ahead of this massive data drop to secure the global rights to GPS.
The Bear Case:
On the flip side, bears point to recent dilution. Just a week ago, shareholders approved an amendment to expand the company's available share pool by 20 million shares. While some of this is for employee incentives, bears argue that Sellas could use its At-the-Market (ATM) equity facility to sell shares into this rally, diluting existing investors to raise more cash before the trial results drop.
The Technical Blueprint: Reading Between the Lines
From a technical perspective, the sudden injection of volume has completely changed the character of the $SLS chart.
Before this week's news, $SLS was enduring a choppy June, down roughly 14% on the month and trapped under heavy overhead resistance. However, this volume-backed surge has allowed the stock to aggressively reclaim its 20-day Exponential Moving Average (EMA), turning a previous resistance zone back into potential short-term support.
When analyzing the momentum, keep a close eye on the Relative Strength Index (RSI). The RSI is currently ramping up but still leaves plenty of room to run before hitting overbought territory (above 70). This indicates that the buying pressure is being driven by structural accumulation—likely institutions and short sellers scrambling to cover their positions—rather than pure retail FOMO. If volume stays significantly above its 30-day average, it confirms that large players are defending this breakout.
Disclaimer: This article is for informational and educational purposes only and is not financial advice. Always do your own research and manage risk carefully.
The Execution: Full Trading Plan for $SLS
With massive volume flooding into Sellas Life Sciences, trying to chase this asset blindly is a quick way to get caught on the wrong side of a biotech whip. To trade $SLS successfully right now, you need to treat the $9.84 level as your line in the sand.
Here is exactly how to manage your risk and execute the setup whether you are looking to ride the momentum long or catch a breakdown short.
🟩 The Bullish Game Plan: Riding the Buyout Momentum:
If you are looking to play $SLS to the upside, the key is ensuring the bulls defend structural support on any intraday pullbacks.
The Trigger: Look for long entries on a clean retest and bounce off the $9.84 must-hold level, or a high-volume breakout sustained above $10.00.
Risk Management: Your hard stop-loss should be placed just below $9.84 (depending on your personal risk tolerance, $9.75 allows minor breathing room for stop-hunting wicks). If it breaks and closes below $9.84 on a 15-minute or hourly candle, the near-term bull case is invalidated.
Long Profit Targets:
$10.00: Psychological resistance and initial scaling point.
$10.50: Local structural resistance; take partial profits here to lock in a risk-free trade.
$11.00: Key multi-month supply zone where sellers have previously stepped in.
$12.00: Major breakout extension target.
$15.00 (Squeeze Mode): If the Phase 3 REGAL trial unblinding drops or a buyout offer is officially leaked, shorts will be forced to cover instantly, exposing a vacuum up to the $15.00 mark.
🟥 The Bearish Risk Strategy: The Breakdown Setup
Biotech rallies built on executive compensation tweaks can turn into "sell the news" traps if the company decides to utilize its newly approved 20-million-share expansion pool for an overnight dilution offering.
The Trigger: If the stock aggressively breaks below the $9.84 must-hold pivot on heavy selling volume, the momentum shifts. Look for short entries or put options on a broken retest of $9.84 acting as new overhead resistance.
Risk Management: Keep a tight stop-loss just above $10.10. If the bulls quickly reclaim the double-digit mark, cut the short immediately.
Short Profit Targets:
$9.30: Initial liquidity pocket and previous minor intra-day support.
$8.90: Re-entry into the older monthly consolidation channel.
$8.80: Major downside target aligning with the lower boundaries of the recent breakout base.
The Golden Rule for $SLS:
Never allocate more capital than you are willing to risk on a binary biotech play. Trade the price action, keep your position sizing disciplined, and let the levels dictate your execution.