
$DJT Stock Analysis: Crucial Hold Level & Breakout Price Targets
In-depth $DJT (Trump Media) stock analysis and technical trade setup. Key "Must Hold" support level at $9.15 with upside breakout price targets reaching $11.11.
STOCK ANALYSIS
$DJT Stock Analysis: Trump Media & Technology Group Deep-Dive
$DJT Trending Catalyst:
Core Market Drivers Shaping $DJT Volatility:
Event-Driven Price Action: Ticker $DJT operates as a high-beta momentum asset, with price fluctuations heavily tied to news cycles, public announcements, and surrounding market sentiment.
Sentiment vs. Financial Multiples: Unlike conventional equities that trade strictly on standard earnings metrics, $DJT frequently demonstrates aggressive price moves powered by retail volume and headline velocity.
Elevated Intraday Liquidity: High daily trading volume creates frequent breakout opportunities, making the stock a prime watchlist candidate for momentum traders and swing strategists.
Strategic Catalysts Every Trader Must Track:
Cash Reserves & Capital Allocation: Monitoring liquidity, burn rate, and potential platform expansion plans into streaming or digital media infrastructure is essential for long-term outlooks.
Short Interest & Squeeze Potential: Elevated short interest levels create continuous potential for sharp short-covering rallies whenever buying pressure spikes.
Regulatory & Corporate Filings: Regular SEC updates, governance disclosures, and legal developments serve as immediate, high-impact catalysts for price gaps.
Primary Risk Factors & Market Sentiment Indicators:
Asymmetric Risk-Reward Dynamics: Extreme technical swings necessitate structured risk management, explicit stop-loss parameters, and disciplined position sizing.
Macro Environment & Retail Participation: Broader shifts in retail investor engagement, tech sector sentiment, and market liquidity directly influence key support and resistance channels.
Unrivaled Brand Visibility: Massive public attention drives consistent organic search interest and online discourse, maintaining a persistent retail trading focus on $DJT.
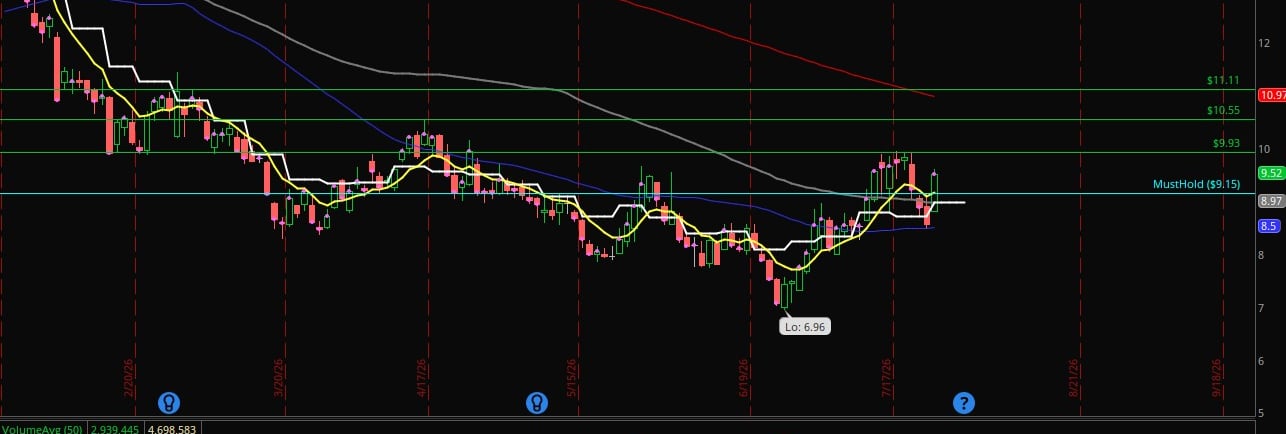
📊 $DJT Stock Price and Key Levels
Current Price: ~$9.52
Key Pivot ("Must Hold"): $9.15
Immediate Resistance / Target 1: $9.93
Secondary Resistance / Target 2: $10.55
Major Resistance / Target 3: $11.11 (aligns with the descending red trendline around $10.97)
Lower Support Levels: $8.97 (grey indicator line) and $8.50 (blue moving average)
Cycle Low: $6.96
📈 Full Trading Plan Strategy:
Note: This plan assumes a short-to-medium-term swing trade based on the daily chart structure shown.
🐂 Primary Long Setup (Trend Continuation):
🎯 Entry Zone: Look for entries on a pullback near $9.20 – $9.50, or on a high-volume breakout and hold above $9.52.
🛡️ Stop Loss (Hard Invalidation): Just below $9.15 (e.g., $9.08). If price loses the $9.15 "Must Hold" line on a daily close, the long thesis is invalidated.
🚀 Profit Targets:
TP 1: $9.93 (Scale out 30–50% of position and move stop-loss to breakeven)
TP 2: $10.55 (Scale out another 30%)
TP 3: $11.11 (Runner target near major trendline resistance)
🐻 Contingency / Pullback Plan (If $9.15 Fails):
⚠️ Short/Sidelines Trigger: If price breaks down below $9.15, expect a retest of lower support zones.
🛡️ Key Bounce Watch Zones: $8.97 and $8.50 (the blue moving average line). Look for stabilization and bullish reversal candles at these lower levels before considering a re-entry.
⚖️ Risk-to-Reward Breakdown:
Risk: ~$0.37–$0.40 (Entry ~$9.50 down to Stop Loss ~$9.08)
Reward to TP 1: ~$0.43 (1:1.1 R/R)
Reward to TP 2: ~$1.05 (1:2.8 R/R)
Reward to TP 3: ~$1.61 (1:4.3 R/R)
❓ Frequently Asked Questions ($DJT Trading Plan)
1️⃣ 📌 What is the critical "Must Hold" level for $DJT?
The key technical pivot level is $9.15. As long as price holds above this line on a daily closing basis, the bullish momentum thesis remains intact. A daily close below $9.15 invalidates the trade setup.
2️⃣ 🎯 What are the primary take-profit targets for this trade?
Target 1 (TP1): $9.93 — Ideal level to trim 30–50% of the position and scale down risk.
Target 2 (TP2): $10.55 — Secondary resistance for taking additional profits.
Target 3 (TP3): $11.11 — Major resistance target aligning near the long-term descending trendline.
3️⃣ 🛡️ Where should the stop loss be set, and what is the Risk-to-Reward ratio?
A logical hard stop-loss is placed just below the key pivot at $9.08. Risking approximately $0.37–$0.40 per share against a top target of $11.11 provides an attractive overall Risk-to-Reward ratio of up to 1:4.3.
4️⃣ 📉 What is the game plan if $DJT breaks below $9.15?:
If price breaks below $9.15, avoid buying into weakness immediately. Instead, wait for price to stabilize near lower structural support zones at $8.97 or the $8.50 moving average line before looking for new reversal entry signals.
5️⃣ ⚡ Is $DJT better suited for options or equity shares?
Because $DJT is a high-beta, event-driven stock with elevated implied volatility, equity shares offer precise stop-loss execution without option time decay risks. However, traders using options often prefer defined-risk spreads or short-dated calls to capitalize on sudden breakouts above $9.52.