
$SNAP Stock Price Prediction Today: Crucial $5.16 Level
$SNAP stock price collapses on AR glasses cost concerns. See if Snap can defend the critical $5.16 anchor with our complete trading plan.
MOMENTUM STOCKS
Why is $SNAP Trending Today?
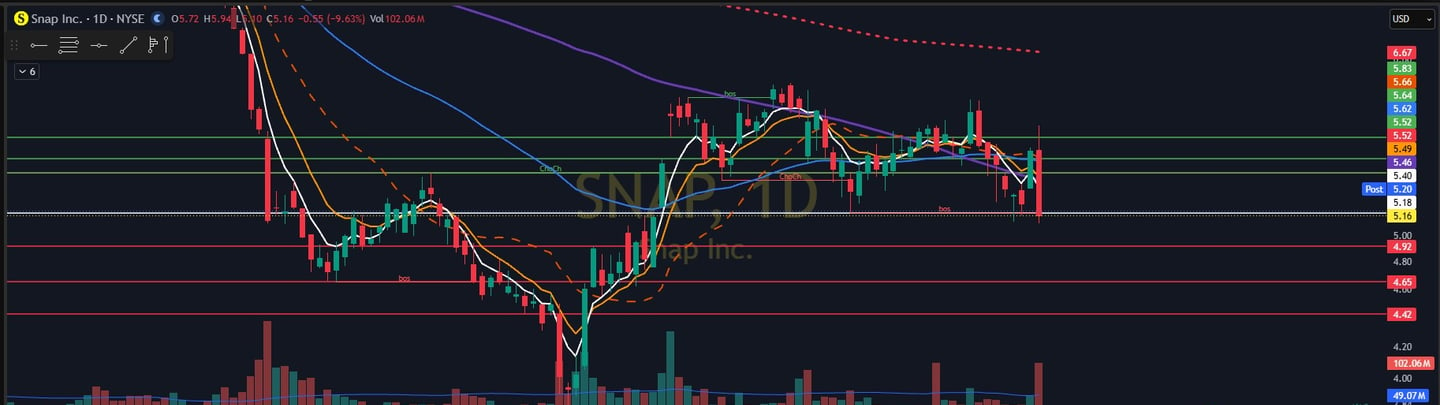
Snap Inc. ($SNAP) has turned into a high-velocity volatility trap on the tape, suffering a severe -9.63% intraday liquidation on a massive volume surge of 102.06 million shares. The aggressive distribution occurred as the market digested CEO Evan Spiegel's keynote presentation at the Augmented World Expo (AWE). While the technology behind Snap's newly unveiled "Specs" augmented-reality glasses impressed developers, the premium $2,195 price tag shocked retail and institutional desks alike. Compounding the pricing anxiety, Spiegel admitted that a massive spike in global memory chip costs has been "quite impactful" on their manufacturing margins, raising serious concerns that hardware supply chain constraints will delay profitability.
From a structural tape perspective, this hardware cost warning triggered an immediate risk-off reaction from systematic models, driving a violent intraday reversal from a high of $5.94 to close exactly on your critical white line in the sand at $5.16. This rapid descent has completely re-hedged the option chains, forcing market makers to aggressively dump underlying stock to keep pace with accelerating negative delta. Pinned directly on the $5.16 pivot, the order book is locked in an intense, highly coiled state ahead of the next opening bell.
$SNAP Long Setup: What are the Key Breakout Levels?
For a long tactical recovery to develop, the tape must stage a definitive reclamation and sustained defense of the $5.16 macro pivot. Because price action closed directly on this line, attempting to buy the open without confirmation is highly risky. Long-focused desks must wait for live order flow to demonstrate that institutional block buyers are actively absorbing supply at $5.16, establishing a firm support platform on the hourly chart before deploying size.
Once $5.16 is validated as a support floor, the upward gap-fill targets your exact key resistance levels. The primary target rests at $5.46 (Target 1), aligning with the dark green daily resistance node. Successful absorption at this level shifts the gamma profile back toward neutral, clearing a path to test the next major green target at $5.52 (Target 2). If buy-side volume accelerates and squeezes the short-sellers, the ultimate stretch target on this corrective bounce maps directly to $5.64 (Target 3), which represents the source of today's technical breakdown.
$SNAP Short Setup: What are the Key Levels?
The bearish fade framework remains the dominant path of least resistance as long as distribution algorithms successfully keep the price capped beneath the $5.16 macro resistance pivot. If the market attempts an early morning bounce but prints a clear tape rejection at $5.16—characterized by a dry-up in buy-side volume and an immediate acceleration of offer-side block orders—short-focused desks can deploy capital into a high-probability continuation of today's sell-off.
Once the failure at $5.16 is locked in, the downside target progression aligns perfectly with your red support zones. The first target is $4.92 (Target 1), which serves as the immediate local liquidity node. If sell-side institutional volume breaks through this floor, it will trigger secondary systematic models, paving the way for a rapid drop to major daily support at $4.65 (Target 2). In the event of a full capitulation wash-out, the final downside target maps to the structural swing-low support at $4.42 (Target 3).
Disclaimer: This article is for informational and educational purposes only and is not financial advice. Always do your own research and manage risk carefully.
$SNAP Full Trading Plan & Execution Matrix (TL;DR)
The Long Execution Matrix:
Tactical Entry & Support Pivot: Clean hourly reclaim and verified buy-side volume absorption at the $5.16 pivot.
Primary Breakout Targets: $5.46 (First Green Resistance), $5.52 (Second Green Resistance), $5.64 (Previous Breakdown Source).
Risk Management Invalidation: An explicit hourly close or structural tape degradation back below $5.16.
The Short Execution Matrix:
Bearish Fade Trigger: Failure to hold $5.16 on the open, or a clear volume-backed rejection of the $5.16 pivot from below.
Downside Profit Targets: $4.92 (First Red Support Node), $4.65 (Major Daily Support), $4.42 (Structural Swing-Low Support).
Risk Management Invalidation: A decisive hourly reclaim and expansion back above $5.16.
Strategic Bottom Line:
The $5.16 level is the absolute line in the sand for Snap. Since the stock closed exactly on this pivot, the first 30 minutes of the session will tell the entire story. If the tape fails to hold $5.16, we are looking at a fast technical flush toward $4.92 and potentially $4.65. Conversely, if institutional buyers step in to defend the hardware story, a quick reclaim of $5.16 opens the door for a short-covering rally to $5.46.