
How to Trade Economic Data: Complete 2026 Guide
Master how to read, track, and trade economic data in 2026. Learn how to get free trading economics data and execute advanced calendar day trading strategies.
Trading economic data requires looking past the raw numbers printed in the mainstream news. For a day trader, macroeconomic data releases are pure liquidity triggers. To survive and profit from these high-velocity events, you must master the mechanics of how the market processes macroeconomic indicators and maps them to immediate asset repricing.
The Actual vs. Forecast Consensus Mechanism
The absolute value of an economic report never moves the market in isolation. Price action is driven entirely by the variance between the "Actual" reported number and the Wall Street "Forecast" consensus. Prior to any major release, institutional desks price their directional bias into the market based on consensus estimates.
Inline Releases: If an economic indicator prints exactly in line with the forecast, the data is already priced in. Volatility remains low, and the market typically continues its pre-release trend.
Deviation Shocks: When the actual data deviates significantly from the consensus, an immediate structural repricing occurs. A positive deviation in expansionary data (like Non-Farm Payrolls or GDP) causes a rapid surge in equities and the domestic currency, while a hotter-than-expected inflation print (like CPI) drives yields higher and forces a sharp algorithmic sell-off in risk assets.
Critical High-Impact Indicators to Track
Not all data on the economic calendar is created equal. To avoid over-trading, focus exclusively on high-impact market-movers that force central banks to adjust monetary policy:
Inflation Metrics (CPI & PCE): The Consumer Price Index and Personal Consumption Expenditures reports are the ultimate gauges of currency purchasing power. In the current market regime, these reports dictate federal interest rate trajectories.
Employment Data (NFP & Unemployment Rate): Released on the first Friday of every month, the Non-Farm Payrolls report offers a real-time health check on corporate expansion and wage inflation pressures.
Central Bank Decisions (FOMC): The Federal Open Market Committee rate decisions and subsequent press conferences are the apex volatility events, dictating the macro cost of capital.
How to Read Economic Data and Track Indicators
Elite intraday execution requires clean historical benchmarking. You cannot safely trade an economic release unless you know how the market historically behaves when a specific indicator misses or beats expectations by a certain percentage. Fortunately, you do not need an expensive institutional terminal subscription to access this institutional-grade information.
Accessing Premium Macro Datasets at Zero Cost
Acquiring comprehensive macro historical data for free is highly straightforward if you know where to source it. Platforms like Trading Economics provide robust, real-time macroeconomic feeds across global economies. While they offer paid API access for algorithmic funds, retail day traders can easily track, filter, and view historical macro charts directly through their open database web interfaces without paying a dime.
For raw, unedited historical data, the Federal Reserve Bank of St. Louis maintains the FRED (Federal Reserve Economic Data) database. This completely free public utility tracking hundreds of thousands of economic time series allows you to monitor structural economic shifts with flawless, unbiased historical accuracy.
Sourcing and Downloading Macro Data for Strategy Backtesting
To transform raw indicators into a functional day trading strategy, you need to download historical datasets to analyze the exact price boundaries of previous market reactions.
By navigating to specific indicator pages on free macro tracking sites or the FRED database, you can utilize the native "Export" or "Download" features to pull the data directly into a CSV or Excel format. Once downloaded, you can cross-reference the exact historical release dates and times against your charting software's intraday historical candles. This allows you to measure the average 5-minute and 15-minute price expansion range following a data shock, giving you a mathematically backed expectation of your potential trade targets and stop-loss boundaries.
How to Get and Download Trading Economics Data for Free
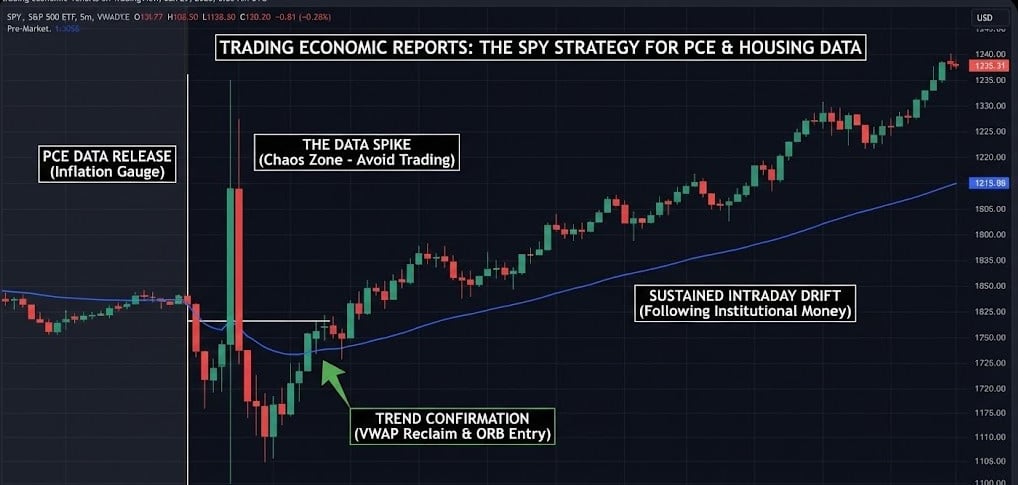
Attempting to click "Buy" or "Sell" the exact millisecond economic data crosses the wire is a guaranteed way to suffer catastrophic slippage. During high-impact releases, market-making algorithms completely pull liquidity from the order book for several seconds to avoid toxic exposure. This widens the bid-ask spread massively. Advanced tactical data trading focuses on executing around the release rather than gambling on the immediate flash print.
The Post-Release Retest and Structural Absorption Strategy
The most reliable intraday framework for trading the economic calendar is the post-release structural absorption strategy. This approach relies on letting the initial programmatic algorithmic spike conclude before risking capital.
The Wait Phase: When a high-impact report drops at 8:30 AM EST, do not enter the market. Allow the first 5 to 10 minutes of wild, highly illiquid price expansion to exhaust itself.
The Level Identification: Identify the key pre-release support or resistance level that the stock or index ETF broke through during the initial data spike.
The Tactical Entry: Wait for price action to pull back and retest that broken structural level from the outside. If the market prints an aggressive rejection candle on the 2-minute or 5-minute chart, confirming that institutional size is absorbing the pullback, enter your position in the direction of the initial data spike. Place your hard stop-loss immediately behind the newly formed absorption tail.
The Pre-Event Volatility Expansion Straddle
For sophisticated options day traders, trading data revolves around capturing premium expansion rather than guessing the directional outcome of an economic calendar event.
Because uncertainty peaks right before major reports like CPI or FOMC, implied volatility (IV) aggressively inflates during the 24 hours leading up to the release. An advanced tactical play involves buying a directional straddle (purchasing both an at-the-money call and put option) late the afternoon prior to a massive morning data release. As retail and institutional hedging intensifies leading up to the event, the rapid expansion of implied volatility pumps up the pricing of both options premiums. Traders can often scalp a highly profitable 20% to 30% gain on the position and close it out entirely at 8:25 AM EST—extracting pure profit from the pre-event panic while carrying zero exposure into the actual data release.
How to Trade the Economic Calendar: Advanced Strategies
If you want to master more high-velocity market events, check out our other comprehensive trading guides:
➡️VIX Trading Strategy Guide
➡️How to Trade Quad Witching
➡️How to Trade Earnings Reports