
VIX Trading Strategy: Complete 2026 Guide
Master VIX index trading in 2026. Learn volatility economics, contract trading hours, and advanced intraday volatility index trading strategies.
To profit from market panic, you must first master the structural economics of the Cboe Volatility Index (VIX). Known colloquially as the market's "fear gauge," the VIX does not track historical market drops or current price action. Instead, it is a forward-looking mathematical calculation that measures the implied volatility of S&P 500 index options over the upcoming 30-day period. Understanding this underlying economic mechanism is what separates consistently profitable volatility day traders from speculative gamblers.
The Inverse Correlation Engine
The core foundational economic law of the VIX is its intense, structurally embedded inverse correlation to the broader equity markets. When the S&P 500 slides or crashes, institutional portfolio managers aggressively buy out-of-the-money put options to hedge their multi-billion-dollar long portfolios.
This localized surge in options buying drives option premiums sky-high, inflating implied volatility and causing the VIX index to spike violently upward. Because fear is an immediate, reactive emotion, VIX spikes are typically fast, vertical, and explosive, whereas VIX contractions are slow, grinding processes that mirror the steady appreciation of a healthy bull market.
The Absolute Law of Mean Reversion
Unlike standard corporate equities, which can theoretically scale to infinity or drop to zero, the VIX index is tied directly to a mathematical percentage. It is an absolute mean-reverting asset.
Volatility cannot stay elevated permanently because markets eventually adjust to new macroeconomic environments, and uncertainty evaporates. Historically, the VIX establishes a distinct baseline or floor during quiet economic regimes. When macroeconomic or geopolitical shocks drive the VIX to extreme historical highs, a clear alpha-generating opportunity arises for day traders to systematically position for an inevitable collapse back down toward the historical statistical mean.
The Economics of VIX Index Trading and Market Volatility
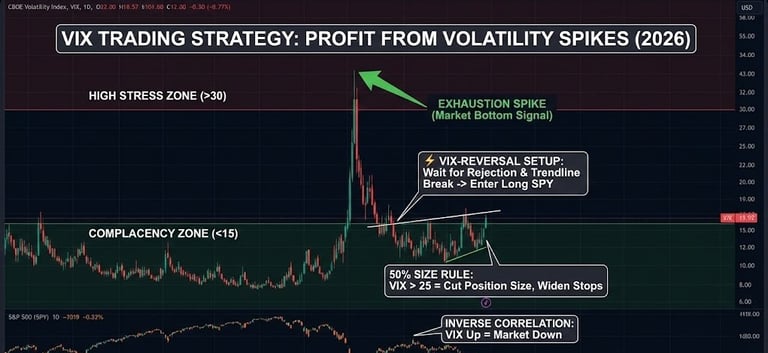
A major barrier for new traders is realizing that the spot VIX index itself cannot be bought or sold directly. It is purely an indicative index code. To trade the concepts suggested by the data in 20898.jpg, you must utilize derivative products—specifically VIX futures, VIX options, or volatility-tracking exchange-traded products (ETPs). Executing these vehicles safely requires pristine timing based on structural market hours.
Mastering Volatility Global Trading Hours
Market-shattering geopolitical news, sudden macro data leaks, and foreign central bank decisions rarely wait for the 9:30 AM EST New York opening bell. Therefore, true volatility trading occurs around the clock.
Global Trading Hours (GTH): Proprietary volatility products, including VIX options and VIX futures, trade in an extended overnight session starting at 8:15 PM EST and running straight through the pre-market to 9:25 AM EST.
Regular Trading Hours (RTH): The standard high-liquidity session executes between 9:30 AM EST and 4:15 PM EST.
Curb Session: A late-afternoon wrap-up window operates from 4:15 PM EST to 5:00 PM EST.
Because liquidity thins during the overnight GTH session, price swings can be highly exaggerated. Professional day traders monitor the overnight futures action to identify structural order blocks, but they wait until the RTH opening bell injects heavy institutional volume before establishing core positions.
The Spot vs. Futures Term Structure Indicator
Before entering an intraday volatility play, you must look at the VIX Term Structure, which measures the price difference between the spot VIX index and the forward-month VIX futures contracts.
Contango (Normal Market State): In normal market regimes, future months are priced higher than the current spot price because uncertainty increases further out on the timeline. This environment acts as a structural drag on long-volatility exchange-traded funds, causing them to decay over time.
Backwardation (Panic Market State): During severe market liquidations, the near-term spot VIX surges drastically above the future month contracts. This extreme disruption signals that immediate panic has broken the market, offering a high-probability indication that a broader equity market bottom is forming.
Deciphering VIX Indicator Metrics and Volatility Trading Hours
When transitioning from monitoring the VIX indicator to executing live, intraday capital, you must use precise, rules-based strategies that leverage the index's structural boundaries to trade equity indices or volatility ETFs.
The VIX Intraday Envelope Mean Reversion Strategy
Because the VIX is mean-reverting, its intraday price extensions frequently hit definitive mathematical boundaries before snapping back. Day traders can use these extensions as a leading indicator to time exact reversal entries on index ETFs like SPY or QQQ.
The Setup: Apply a 20-period moving average with a 2-standard deviation Bollinger Band envelope directly to the intraday spot VIX chart.
The Trigger: Wait for a violent morning market sell-off where the spot VIX aggressively pierces through its upper 2-standard deviation band. Do not buy the equity index while the VIX is riding this upper band.
The Execution: The exact moment the VIX prints a definitive 5-minute reversal candle that closes back inside the upper Bollinger Band envelope, it signals that peak morning options panic has been fully absorbed. Enter a long equity position (or short volatility position) immediately, placing your structural stop-loss right at the matching intraday low of the equity index.
The VIX Futures Gap-Fill Continuation Strategy
VIX futures frequently gap up or down during the overnight Global Trading Hours session due to international news catalysts. When the U.S. regular trading session opens, these overnight gaps provide highly liquid breakout opportunities.
The Strategy Framework: If VIX futures gap up significantly at the 9:30 AM EST open due to an overnight scare, observe the first 15 minutes of regular market volume.
The Breakout Entry: If the price action fails to quickly fill the overnight gap within the first 15 minutes and instead breaks cleanly above the high of the opening range, it indicates that institutions are actively buying protective hedges in real-time.
The Execution: Enter a long volatility position (via call options or leveraged volatility ETFs) on the breakout of the 15-minute opening high. Hold the position as a high-velocity momentum scalp, trailing your stop-loss aggressively at the VWAP line, and liquidate the entire position prior to the afternoon Curb session to completely eliminate overnight gap-risk.
Advanced Volatility Index Trading Strategies for Day Traders
If you want to master more high-velocity market events, check out our other comprehensive trading guides:
➡️How to Trade Quad Witching
➡️How to Trade Economic Data
➡️How to Trade Earnings Reports