
How to Trade Volume: The Complete 2026 Guide
Master how to trade volume in 2026. Learn to use volume profile indicators, analyze volume delta, and exploit volume imbalances across markets.
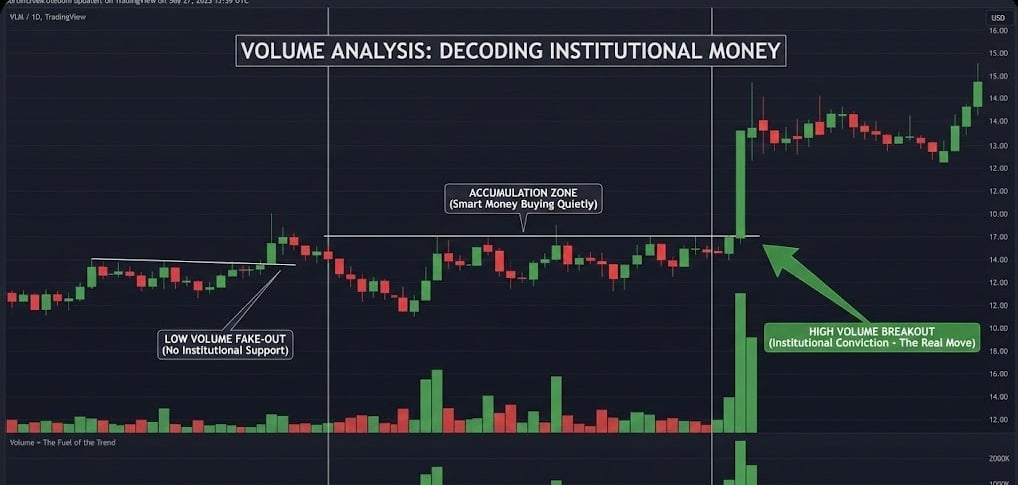
Table of Contents:
How to Trade Volume Profile and the Profile Indicator
How to Trade Volume Imbalance and Volume Candles
How to Trade Volume Delta in Stocks, Forex, and Crypto
Traditional volume indicators plot vertical bars at the bottom of your chart, telling you exactly when transactions occurred during a trading session. While useful, vertical volume lacks spatial context. To trade with an institutional edge, you must transition to horizontal volume analysis by mastering the Volume Profile indicator. This tool tracks volume by price rather than time, mapping out exactly where major funds have allocated capital.
Deconstructing the Volume Profile Framework:
When you overlay a Volume Profile indicator onto your chart, it organizes price data into a horizontal histogram. This structure reveals the structural architecture of the market auction through three critical components:
Point of Control (POC): This is the single horizontal price level where the absolute highest concentration of volume was executed during the selected lookback period. The POC represents the ultimate fair value area where institutions are most comfortable transacting. It acts as an incredibly powerful price magnet.
The Value Area (VA): This represents the price range where 70% of the total volume was executed during the session. The boundaries are defined as the Value Area High (VAH) and the Value Area Low (VAL).
High Volume Nodes (HVN) vs. Low Volume Nodes (LVN): HVNs are prominent peaks in the profile histogram showing heavy historical accumulation, acting as strong support or resistance walls. LVNs are hollow valleys in the histogram where very few shares changed hands, representing zones of low liquidity where price will rapidly slice through without friction.
The Volume Profile Trading Strategy:
To execute a strategy using the Volume Profile indicator, you look for price to deviate away from the Value Area and target the outer boundaries.
When price action breaks out above the Value Area High, it indicates that aggressive buyers are attempting to mark up the asset. However, if the breakout candle fails to sustain momentum and price slips back inside the VAH boundary, it triggers a highly reliable mean-reversion short setup. Because the space inside the Value Area has already been heavily transacted, the price will typically flush directly through the internal Low Volume Nodes, targeting the Point of Control (POC) as the primary take-profit level, and the Value Area Low (VAL) as the secondary target.
How to Trade Volume Profile and the Profile Indicator
Markets move from periods of balance to periods of imbalance. A standard technical chart treats every candlestick equally based on its open, high, low, and close. True volume-based price action trading relies on identifying localized volume imbalances and explosive volume candles, which reveal exactly where an aggressive market participant forced their way into the market and left an unfair delivery of price.
The Mechanics of a Volume Imbalance:
A volume imbalance occurs when aggressive market orders completely overwhelm passive limit orders on the opposing side of the ledger. This sudden surge in transaction speed causes the market to skip price levels entirely, creating a structural gap between the body of consecutive candles.
Unlike a standard gap that occurs overnight, an intraday volume imbalance is printed when a high-velocity candlestick expands so rapidly that the current candle's body does not overlap with the body of the preceding or succeeding candle. This indicates an extreme lack of liquidity during the move. Institutions view these imbalances as inefficiencies that must eventually be repaired. The market will routinely retrace its steps to re-test and fill these precise volume gaps before continuing in the direction of the macro trend, creating a pristine entry zone for patient day traders.
Trading the High-Volume Candle Breakout:
A volume candle is defined as a wide-range price candle whose accompanying volume bar is at least 2 to 3 times greater than the 20-period moving average of volume. This is the explicit footprint of institutional participation.
The Setup: Identify a clear consolidation range where price has been moving sideways on diminishing, below-average volume.
The Breakout Candle: Wait for a single, definitive candle to break completely outside of the range. This candle must close near its absolute high (for a bullish break) or its low (for a bearish break) and be backed by an undeniable volume candle spike.
The Execution Framework: Do not chase the immediate extension. Instead, mark the exact open and midpoint of that high-volume breakout candle. Institutions will frequently defend the entry price of their own block orders. Wait for a lower-timeframe pullback to test the midpoint or open of the breakout candle, and enter your position with a tight stop-loss placed immediately below the structural floor of the original consolidation pattern.
How to Trade Volume Imbalance and Volume Candles
To master order flow analysis, you must look beneath the surface of total volume. Total volume simply tells you the aggregate number of contracts or shares traded. Volume Delta takes this analysis a step further by calculating the exact difference between buying pressure and selling pressure at the micro-level, subtracting the volume traded at the bid from the volume traded at the ask.
Interpreting Cumulative Delta Divergences:
Volume Delta is typically tracked using a Cumulative Delta indicator, which aggregates the delta values over the course of the trading session. This indicator allows you to spot critical divergences between price direction and net-aggressive order flow.
If an index ETF or cryptocurrency makes a fresh intraday high on its price chart, but the Cumulative Delta indicator prints a lower high, it reveals a severe structural trap. This bearish delta divergence proves that while passive limit orders are allowing the price to drift higher, aggressive market buyers have completely stopped participating. This indicates that institutional distribution is occurring under the surface, signaling an imminent trend reversal.
Executing Delta Across Different Asset Classes:
The underlying plumbing of the asset class you are trading dictates exactly how you must interpret volume data:
Stocks: Equities utilize a completely centralized exchange tape (the Consolidated Tape Association). This means every single share traded at the bid or ask is recorded with 100% accuracy, making Volume Delta and order-book imbalances highly precise for identifying institutional blocks.
Crypto: The cryptocurrency market is decentralized across multiple isolated exchanges. To trade volume delta effectively in crypto, you must analyze the perpetual futures market-wide aggregate delta. Tracking the relationship between open interest and net-market delta tells you whether a rapid price expansion is driven by sustainable spot accumulation or aggressive leveraged short-squeezing.
Forex: Because the foreign exchange spot market is completely decentralized without a single clearinghouse, true volume data does not exist. Forex traders must rely on "Tick Volume" as a proxy indicator. Tick volume measures the number of price changes within a given time interval. While it does not track raw share size, studies show a 90% correlation between tick volume adjustments and actual institutional monetary flow, allowing forex traders to spot volume candle expansions and structural imbalances with remarkable reliability.
If you want to master more high-velocity market events, check out our other comprehensive trading guides:
➡️VIX Trading Strategy Guide
➡️How to Trade Economic Data
➡️How to Trade Earnings Reports