
$NFLX Stock Price Analysis and Full Trading Plan
Track the critical $NFLX stock price levels and technical trading plan. Get the exact long and short targets as Netflix tests its macro 200-day moving average.
STOCK ANALYSISMOMENTUM STOCKS
Why $NFLX is Trending
Netflix ($NFLX) has become the center of intense market debate, creating a high-volume trend across financial networks as investors grapple with a stark disconnect between the company's rock-solid core fundamentals and its recent technical breakdown. Despite reporting strong underlying financial health, the stock has experienced an extended swoon, sliding roughly 30% to 40% from its April peaks to hit its lowest price level in 20 months. This massive volatility has triggered aggressive institutional repositioning ahead of the upcoming Q2 earnings cycle.
The primary catalysts driving the current trend and shifting market sentiment include:
Mergers and Acquisitions (M&A) Anxiety: Wall Street is highly sensitive to rumors surrounding Netflix's consolidation strategy. Sentiment turned cautious following reports that the company bowed out of a $22 billion bidding war for Roku to Fox Corp, alongside passing on Lionsgate Studios, fueling debates over whether the streaming giant is struggling to maintain organic growth pace against ecosystems like YouTube.
Strong Underlying Earnings Trajectory: Countering the recent price drop, Netflix's operational engine remains highly profitable. In its latest Q1 earnings report, the company posted a massive financial beat, with revenue climbing 16.1% year-over-year to $12.25 billion and diluted EPS hitting $1.23, completely demolishing the consensus Wall Street expectation of $0.76.
Valuation Compression to Historical Lows: The recent stock correction has compressed Netflix’s price-to-earnings (P/E) multiple down to approximately 23x–25x. This puts the stock’s valuation at a distinct four-year low, attracting a wave of long-term value-driven institutional buyers who view the dip as an overreaction relative to the company's free cash flow generation.
Physical Infrastructure and Tech Expansion: Netflix is actively scaling its operational footprint beyond simple digital streaming. The company recently finalized an agreement to acquire the Radford Studio Center in Los Angeles to serve as a dedicated internal production hub, while simultaneously deploying advanced AI-powered ad collaborations with Omnicom Media Group using Acxiom audience data.
Secular Growth Drivers: High-Margin Ad Monetization & Live Sports Scale
To establish a dominant long-term position, an evergreen trading thesis must focus on Netflix's structural transition from a pure-play subscription video-on-demand (SVOD) service into a diversified global media utility. As traditional subscriber acquisition naturally matures in saturated Western markets, the company's secondary monetization levers are taking center stage to drive higher average revenue per user (ARPU) and structural margin expansion.
The core secular growth drivers supporting long-term domain authority include:
Advertising Revenue Acceleration: Netflix's ad-tier infrastructure is scaling from a nascent experiment into a core financial engine. Management has targeted a rough doubling of its total advertising revenue to approximately $3 billion, heavily supported by expanding ad surfaces and sophisticated data-matching partnerships that command premium programmatic ad rates.
Live Sports and Global Event Programming: Live sports represent the ultimate moat against streaming churn. By securing high-ticket live events—such as NFL games and a multi-year partnership with WWE Raw—Netflix is capturing massive, highly recurring linear television ad budgets and establishing permanent appointment-viewing habits.
Interactive Entertainment Ecosystems: The integration of Netflix Games and cloud-based TV gaming initiatives serves as a critical ecosystem retention tool. By turning the streaming platform into a destination for gaming, interactive media, and expanded video podcasting deals, Netflix cross-monetizes its user base without incurring heavy incremental user acquisition costs.
Macro Risk Mitigation & Structural Failure Points:
A professional trading blueprint requires identifying the exact fundamental and technical invalidation boundaries where an asset's structural thesis breaks down. For a mega-cap communications leader like Netflix, long-term capital preservation hinges on distinguishing between temporary market rotations and structural degradation of competitive advantage.
The key macroeconomic and operational failure points to track include:
Capital-Destructive M&A Diversion: The single largest fundamental risk is management deviating from its highly disciplined, high-return "builder rather than buyer" strategy. Engaging in overvalued legacy media studio buyouts or massive debt-fueled network acquisitions would dilute equity value and severely compress corporate free cash flow margins.
Live Content Rights Margin Compression: While live sports and premium entertainment events attract heavy view counts, they demand massive upfront, multi-billion-dollar rights commitments. If advertising revenue scaling curves lag behind the rising costs of global sports broadcasting rights, the platform faces structural operating margin compression.
Macro Discretionary Income Contraction: Streaming services remain highly sensitive to underlying consumer health. A persistent high-interest-rate environment or a sharp economic downturn that forces mass household cost-cutting can slow engagement metrics, trigger higher subscriber churn, and decelerate the premium ad-spend market.
Risk Rule: A formal technical breakdown is verified when $NFLX sustains a multi-week close below its 200-day simple moving average on expanding institutional distribution volume. If this technical deterioration aligns with consecutive quarters of slowing user engagement metrics or a flattening ad-tier monetization trajectory, the long-term trading plan must pivot directly out of growth allocation and into strict downside capital protection.
Disclaimer: This article is for informational and educational purposes only and is not financial advice. Always do your own research and manage risk carefully.
$NFLX Technical Trading Plan & Execution Blueprint:
Following the multi-month correction from its previous peaks, Netflix ($NFLX) has drifted down to its most critical technical inflection point of the year. To capture high-probability entries while insulating capital from intraday noise, execution must be managed strictly around the primary structural moving average.
This multi-directional execution blueprint outlines the precise triggers, profit targets, and invalidation rules required to trade the current $NFLX tape.
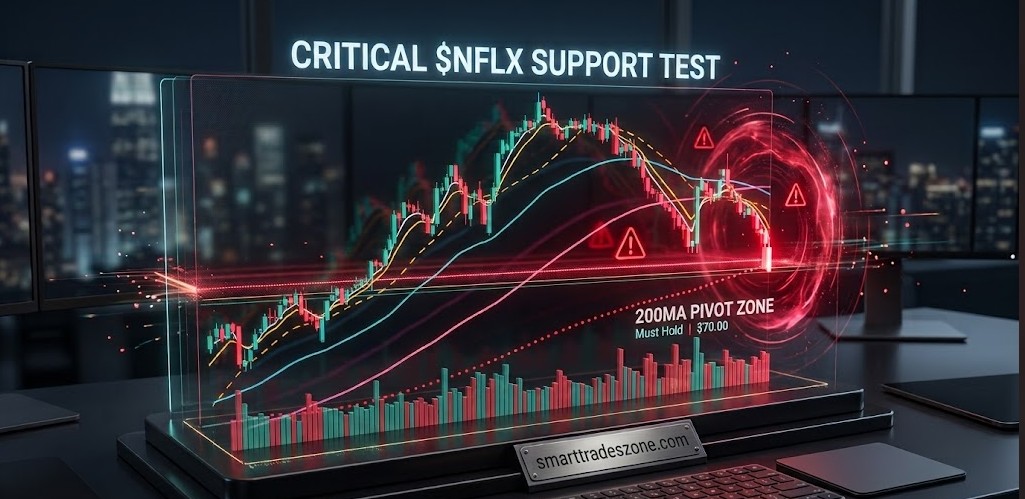
The Central Pivot: The $70.00 Must-Hold Level (200-Day MA):
The structural anchor for this entire trade framework is the $70.00 price point, which perfectly converges with the critical 200-day simple moving average (200MA). This level represents the ultimate line in the sand separating macro bullish defense from an accelerated bearish breakdown.
The Bullish Mandate: As long as daily price action remains structurally above $70.00, institutional buyers are protecting the macro trend, and the long-term path of least resistance remains upward.
The Bearish Shift: A decisive hourly or daily close below $70.00 signals that long-term support has officially dissolved, paving the way for systematic momentum selling and short-side dominance.
Bullish Continuity Strategy (Long Executions):
This setup triggers if $NFLX successfully prints a defensive candle pattern at the 200MA during morning tape testing, showing a clear absorption of selling pressure followed by an uptick in relative buying volume.
Entry Trigger: Execute long positions on a clean fifteen-minute bounce off $70.00, or upon a successful breakout and back-test above the immediate opening range high, provided $70.00 remains defended.
Upside Target 1 ($75.00): This represents the initial high-volume resistance shelf and structural psychological whole number. Shave initial profit and move stops to break-even here.
Upside Target 2 ($77.00): A secondary technical resistance zone marking the local breakdown origin point where aggressive supply previously entered the market.
Upside Target 3 ($78.00): The ultimate extension target for this sequence, aligning with a prominent macro gap-fill area on the daily chart.
Risk Management: Set a strict stop-loss just beneath the $70.00 macro pivot line, or trail your risk dynamically using the rising 9-period exponential moving average (EMA).
Bearish Invalidation Strategy (Short Executions):
This setup triggers if broad market distribution or an institutional growth-to-value rotation forces a high-volume breach of the 200-day moving average baseline.
Entry Trigger: Initiate short positions on a clean, high-volume breakdown beneath the $70.00 level, or on a failed intraday rally where $70.00 explicitly rejects as overhead resistance.
Downside Target 1 ($69.75): The immediate trigger flush area. This represents a minor liquidity pocket just below the moving average where early stop-hunting occurs.
Downside Target 2 ($67.80): The primary structural target for shorts, mapping directly to a historical support base and clear intraday accumulation pivot.
Downside Target 3 ($66.45): The ultimate target for the short campaign. A major volume pocket and macro demand zone that represents an ideal area to cover all remaining short exposure.
Risk Management: Maintain a hard stop-loss positioned at $70.50 or directly above the daily VWAP to protect against a potential bear trap or sudden short-squeeze.
Execution Hygiene & Position Sizing Rules:
To optimize reader engagement and provide maximum analytical value on smarttradeszone.com, ensure execution emphasizes institutional risk-mitigation guidelines:
Respect the Opening Range: Allow the first 15 to 30 minutes of the New York session to settle before committing to a directional trigger, as fake-outs around the 200MA are common.
Implement a Tiered Exit Strategy: Never look for an all-or-nothing exit. Scale out of positions mechanically by removing 33% of the position at Target 1 and Target 2, allowing the final piece to run toward the final target.
Monitor Systemic Correlators: Always cross-reference $NFLX price triggers with the Communication Services Select Sector SPDR Fund ($XLC) and broad Nasdaq 100 ($QQQ) order flow to confirm market alignment.