
$GOOG Dow Jones Trading Plan: $340 Pivot & $363 Gap Fill
Alphabet ($GOOG) faces a high-stakes Dow Jones rebalance. Discover the critical $340 must-hold support, long targets to a $363 gap fill, and downside risk levels.
STOCK ANALYSISMOMENTUM STOCKSINSTITUTIONAL FLOW
Why is $GOOG Trending? Blue-Chip Shakeup: Why Alphabet ($GOOG) Is Dominating Financial Headlines Right Now
When a multi-trillion-dollar tech giant prints massive intraday swings, the entire stock market stops to look. Alphabet Inc. ($GOOG) has been the center of intense debate across trading desks this week, flashing high on volume scanners and setting off fierce bull-vs-bear arguments across financial media.
If you've noticed $GOOG popping up on your radar, it isn't just standard market noise. A massive structural index shakeup is clashing directly with an AI talent war, making this one of the most critical tech setups on the board. Here is exactly what is driving the volatility behind Google and what you need to know before putting capital on the line.
The primary headline catapulting $GOOG to the top of trending watchlists is a historic structural shift: Alphabet is officially joining the Dow Jones Industrial Average.
S&P Dow Jones Indices announced that Alphabet will replace telecommunications giant Verizon Communications ($VZ) in the prestigious 30-stock index before the opening bell on Monday, June 29. This is the first major shakeup to the Dow in over a year and a half, signaling a massive modernization of the index to heavily favor the artificial intelligence and cloud computing era.
This inclusion means that every single passive index fund, ETF, and institutional portfolio that mirrors the Dow Jones is structurally forced to buy millions of shares of Alphabet to rebalance their holdings. However, this massive wave of incoming buy-side liquidity is colliding with heavy selling pressure coming from high-profile AI executive departures and a massive corporate capital raise earlier this month, sparking a dramatic tug-of-war on the daily chart.
Institutional Index Flows vs. The AI Spending Burn
To understand where $GOOG is headed next, we have to look past the surface-level Dow Jones hype and dissect the real money friction keeping the options chain highly active.
The Bull Case:
The bulls are hyper-focused on the wall of institutional money about to hit the stock. Beyond the forced index rebalancing, Google’s core machine is printing cash. Advertising revenues recently surged over 15% year-over-year to $77.25 billion, proving that the integration of the Gemini AI model across Search, Maps, and Smart Bidding is drastically increasing ad monetization precision. For long-term investors, the Dow inclusion is a massive stamp of blue-chip approval.
The Bear Case:
Conversely, the bears are screaming about free cash flow compression and an internal talent exodus. Just days ago, the stock suffered a sharp 7% single-session cliff-dive after two of Google's top-tier AI masterminds departed for rival labs—Gemini co-lead Noam Shazeer moved to OpenAI, and Nobel Prize-winning DeepMind scientist John Jumper joined Anthropic.
Compounding this anxiety is Google's mind-boggling capital expenditure guidance of $180 billion to $190 billion for the year, funded in part by a staggering $84.75 billion equity capital raise earlier this month. Bears argue that this unprecedented infrastructure spending is severely burning near-term free cash flow and diluting shareholders to wage a hyper-expensive AI arms race.
The Technical Blueprint: Reading Between the Lines
From a technical layout, the $GOOG chart has shifted into a high-stakes consolidation zone.
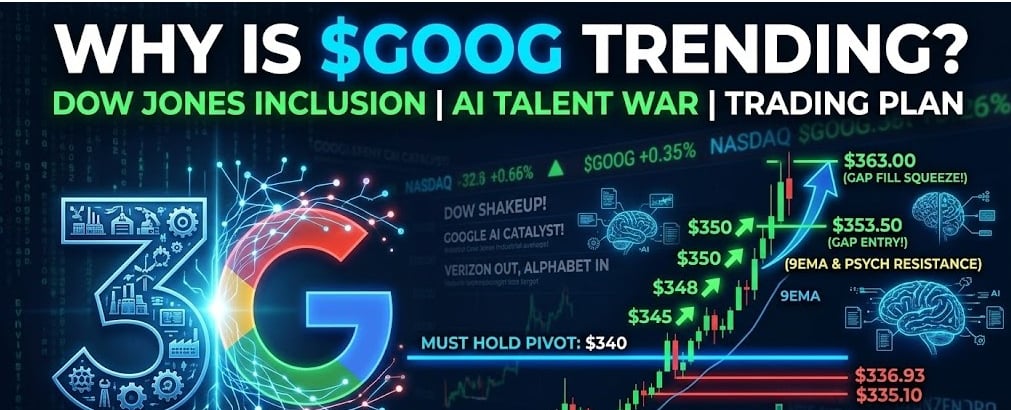
After carving out an all-time high of $408.61 in May, the combination of the multi-billion dollar capital raise and the AI talent departures slammed the stock down to a localized flush point in the $340–$341 range.
The chart is currently attempting to build a structural base right around this $340 liquidity pocket. Momentum indicators like the 14-day RSI dropped into near-oversold conditions during the recent talent exodus sell-off but are now curling back up toward the midline, showing signs of structural accumulation. Traders are watching the short-term Exponential Moving Averages (EMAs) incredibly closely; reclaiming these near-term levels before the official Monday Dow rebalancing would signal that institutional accumulators have officially stepped in to absorb the bear market supply.
The Execution: Full Trading Plan for $GOOG
With the forced Dow Jones index rebalancing hitting the tape, trading Alphabet requires precise execution rather than chasing green or red candles. The absolute line in the sand for this setup is $340.00. How institutional volume reacts at this exact liquidity pocket will dictate the macro direction for the weeks ahead.
Here is your step-by-step risk management and execution roadmap for both the long and short sides of the tape.
🟩 The Bullish Game Plan: Catching the Institutional Rebalance:
If the massive wave of passive index buying successfully defends the local flush point, the bulls have a clear path to squeeze the overextended shorts and look toward a major macro gap fill.
The Trigger: Look for long entries on a clean intraday test and structural bounce off the $340.00 must-hold level, or a high-volume confirmation candle closing above $341.50.
Risk Management: Place a hard stop-loss just below the must-hold level around $338.50. If $340 breaks and prints a full hourly close below it, the immediate bullish thesis is completely invalidated.
Long Profit Targets:
$345.00: Initial psychological resistance and near-term take-profit target.
$348.00: Local minor supply zone; secure partial gains here to guarantee a risk-free trade.
$350.00 (9EMA Confluence): A massive inflection point. This level serves as a psychological magnet and aligns perfectly with the downward-sloping 9-period Exponential Moving Average (9EMA). Expect a heavy battle here.
$353.50 (Gap Entry): Cracking the 9EMA exposes the trapdoor. This is your entry point into the massive vacuum left behind by the recent AI talent exodus sell-off.
$363.00 (Gap Fill): The ultimate macro target. A full structural gap fill back to pre-drop distribution levels.
🟥 The Bearish Risk Strategy: The Cavernous Breakdown:
If the institutional selling pressure from the massive $84B+ equity capital raise completely overwhelms the incoming index-tracking buyers, a structural floor will drop.
The Trigger: Look for short entries or put option triggers if $GOOG aggressively snaps below $340.00 on heavy volume, followed by a failed retest where $340 flips from previous support into heavy overhead resistance.
Risk Management: Keep a tight stop-loss set at $342.50. If the bulls quickly fake out the breakdown and reclaim the $342 level, cut the short immediately.
Short Profit Targets:
$336.93: Initial downside liquidity pocket and localized target for day traders.
$335.10: Minor multi-week horizontal support structure where buyers have previously front-run the dip.
$320.00: The ultimate macro downside target. If $335 fails to hold, there is a technical void down to this deep valuation reset zone.
SmartTradesZone Trading Note:
Trading mega-cap tech during major index additions requires immense patience. Let the market test the $340 pivot first, identify who is aggressively defending the level, and execute exactly when the price action confirms your trigger.