
Candlestick Patterns: Complete 2026 Trading Guide
Master candlestick patterns and meanings in 2026. Learn how to read price action charts with the ultimate day trading cheat sheet.
To accurately interpret a stock chart, a trader must treat Japanese candlestick patterns as the fundamental language of price action. Originally developed by Japanese rice traders in the 18th century, candlesticks provide a clear visual representation of market psychology over a specific timeframe. For beginners navigating the stock market, understanding how to decode the anatomy of a single candle is the first step toward predicting institutional order flow.
The Anatomy of an OHLC Candlestick:
Every individual candlestick records four critical data points for a given period: the Open, High, Low, and Close (OHLC). The visual structure of the candle is divided into two primary segments:
The Real Body: The solid, rectangular portion of the candlestick that measures the exact distance between the opening price and the closing price. If the asset closes higher than it opened, the body is typically colored green or white, signaling bullish dominance. If it closes lower than it opened, the body is colored red or black, indicating a bearish session.
The Wicks (Shadows): The thin vertical lines extending above and below the real body. The upper wick represents the absolute highest price achieved during the session, while the lower wick maps the absolute lowest price.
Deconstructing the Intraday Auction Psychology:
The primary mistake beginners make when analyzing candlestick patterns in stocks is reading them mechanically without understanding the auction context. A long wick is not just a line; it is a footprint of rejection.
For instance, a long upper wick reveals that buyers initially gained control and drove the price to an extreme high, but aggressive supply entered the market before the closing bell, completely overwhelming the demand and forcing the price back down. The body tells you who won the final battle of the session, while the wicks tell you the exact boundaries of the emotional volatility experienced during the trade.
Candlestick Patterns and Meanings for Beginners
While hundreds of patterns exist, a professional framework ignores low-probability formations and focuses entirely on high-conviction reversal and continuation signatures.
High-Probability Bullish Reversal Patterns:
These patterns signal that a downward trend has exhausted its selling pressure and that an influx of institutional accumulation is underway:
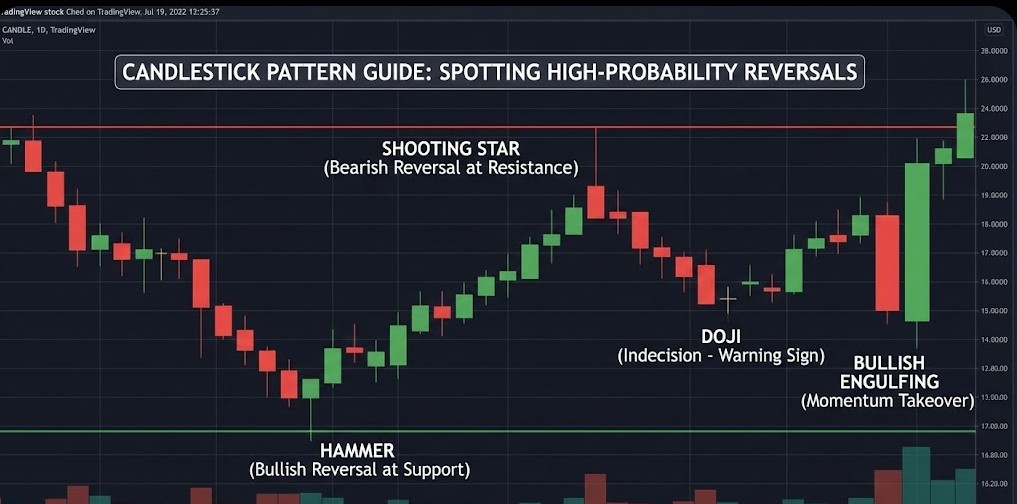
The Hammer: A single-candle pattern featuring a small real body at the top of the range and a long lower wick that is at least twice the size of the body. This structure proves that sellers aggressively pushed the stock lower during the session, but massive institutional buy orders completely absorbed the supply, forcing a strong close back near the open.
Bullish Engulfing: A two-candle formation where a small red body is completely swallowed or "engulfed" by a massive green candle the following day. This indicates a violent shift in sentiment, where buying momentum has totally erased the previous day's distribution.
High-Probability Bearish Reversal Patterns:
These patterns serve as a structural warning that an upward trend has run into a major institutional supply wall:
The Shooting Star: The exact inverse of the hammer. It features a small real body at the bottom of the range and a long, prominent upper wick. This reveals that aggressive buying early in the session was completely trapped and sold into by major funds, turning previous support into immediate overhead resistance.
Bearish Engulfing: Occurs when a dominant, wide-range red candle completely encapsulates the real body of the preceding green candle, signaling that aggressive sellers have taken absolute control of the price ceiling.
The Ultimate Candlestick Patterns Cheat Sheet
In live intraday trading, matching the name of a pattern from a cheat sheet or PDF document is not enough to yield a profitable edge. Professional day traders never execute a trade purely because a hammer or shooting star prints on a chart. Advanced execution requires confirming the candlestick pattern using volume metrics and structural location.
The Law of Technical Location:
A candlestick pattern printed in the middle of a trading range is completely meaningless and should be ignored as random market noise. To achieve a high win rate, the pattern must manifest directly against an established macroeconomic or technical anchor level:
Bullish Signatures: Only execute a hammer or bullish engulfing pattern if it prints precisely as it tests a major horizontal support floor, a rising VWAP line, or a high-volume node on the Volume Profile.
Bearish Signatures: Only trade a shooting star or bearish engulfing pattern if it forms directly against a known daily resistance ceiling, a descending moving average, or a key options open-interest strike wall.
The Tactical Execution and Risk Mitigation Blueprint:
Once a high-probability pattern prints at a valid technical level, you must structure the trade with asymmetric risk parameters before entering the market.
The Trigger: Wait for the candlestick to fully close on your execution timeframe (e.g., the 5-minute or 15-minute chart). Entering mid-candle before the close is a frequent retail trap.
The Entry: Enter the position at the open of the immediately succeeding candle following the pattern's confirmation.
The Hard Stop-Loss: Place your protective stop-loss exactly 1 to 2 ticks beyond the absolute wick extremity of the pattern candle. For a long trade initiated by a hammer, your stop sits immediately below the lowest point of the lower wick. If price action violates that boundary, the institutional defense of that level has failed, and you must exit immediately with a minimal, pre-calculated loss.
The Profit Target: Project your take-profit target to the next major opposing support or resistance level, ensuring your risk-to-reward ratio is at least 1 to 2 or higher, completely insulating your day trading account from systemic volatility.
Advanced Candlestick Patterns for Day Trading
If you want to master more high-velocity market events, check out our other comprehensive trading guides:
➡️VIX Trading Strategy Guide
➡️How to Trade Economic Data
➡️How to Trade Earnings Reports