
Chart Pattern Breakouts: Complete 2026 Guide
Master chart pattern breakout stocks and price action trading in 2026. Learn the ultimate trading strategy and how to configure a technical scanner.

To consistently extract profits from breakout stocks, you must look past the visual lines drawn on a chart and understand the underlying auction mechanics. A chart pattern breakout is not just a geometric phenomenon; it is a real-time representation of an imbalance between supply and demand. When a stock breaks out of a defined technical structure, it signals that the market has reached a tipping point where aggressive buyers are completely overwhelming the available supply of sellers at a specific price floor or ceiling.
The Foundation of Price Action Consolidations
Before a breakout occurs, a stock enters a period of contraction or consolidation. During this phase, price action moves sideways as institutional accumulation or distribution takes place. This coiling action represents compressed market energy.
As the price bounces between established support and resistance boundaries, liquidity builds immediately outside of those ranges. Buy-stop orders accumulate just above historical resistance, while sell-stop orders accumulate right below support. The breakout occurs when price action surges into these concentrated liquidity pools, triggering a cascade of executed orders that rapidly accelerates momentum in the direction of the break.
Mastering the Triangle Chart Pattern Breakout
Among the various consolidation structures, the triangle chart pattern breakout remains one of the most reliable setups in price action trading. Triangles represent a progressive narrowing of a stock's intraday trading range, highlighting a clear volatility contraction before an explosive expansion.
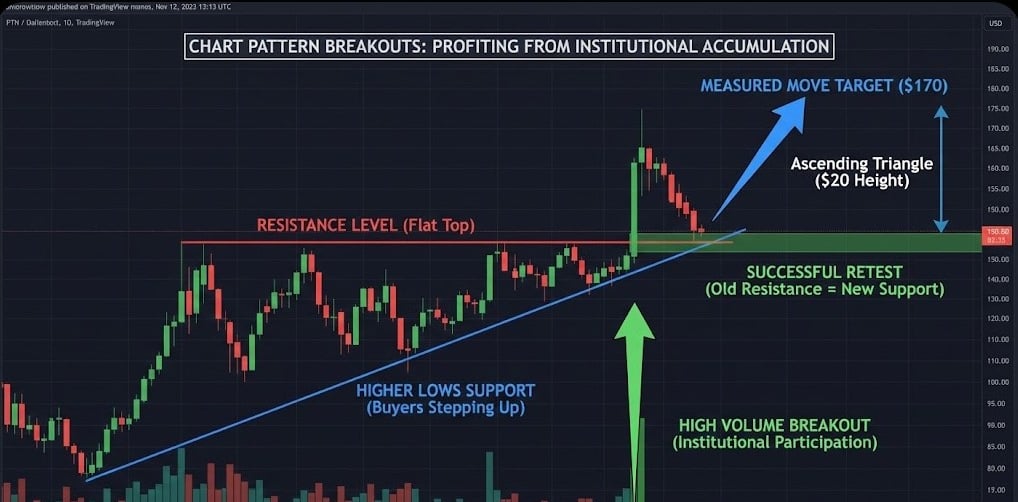
Ascending Triangles: Characterized by a flat horizontal resistance line and a series of higher ascending lows. This structure indicates that buyers are aggressively stepping in at higher prices on each consecutive pullback, steadily forcing the supply side into a corner until resistance snaps.
Descending Triangles: Built with a flat support floor and a series of lower descending highs, indicating aggressive distribution and dominant selling pressure.
Symmetrical Triangles: Formed by two converging trendlines (lower highs and higher lows). This pattern represents a pure neutral coil where both sides are fighting for control, leading to an incredibly violent breakout once one side yields.
Chart Patterns Breakout and Price Action Trading
Trading breakouts successfully requires a definitive, rule-based framework to protect your capital from the most common retail trap: the false breakout, or "fakeout." Institutional algorithms frequently push prices just beyond obvious chart pattern boundaries to trigger retail stops, only to reverse the stock back into the consolidation range. To insulate your portfolio from these traps, your strategy must follow a strict execution cheat sheet.
The Volume Validation Requirement
True price action expansion must always be validated by institutional volume. If a stock attempts to break above a resistance line on low or average daily volume, the move lacks institutional sponsorship and is highly susceptible to an immediate reversal.
An elite breakout strategy dictates that the breakout candlestick must print volume that is at least 150% to 200% higher than the stock's 20-day relative volume average. This surge confirms that major funds are actively driving the asset out of consolidation and are willing to defend the new price territory.
The Rules of Engagement and Stop-Loss Placement
To construct a highly asymmetric risk-to-reward ratio on a breakout trade, your entry and risk parameters must be mathematically locked prior to execution:
The Entry Trigger: Enter the position when a definitive candlestick closes completely outside the pattern's boundary on a major time frame (such as the 5-minute, 15-minute, or daily chart depending on your trading horizon). Avoid buying the intraday flash wick before the candle formally closes.
The Structural Stop-Loss: Never place your stop-loss arbitrarily. For a bullish breakout, position your hard stop-loss immediately below the recent swing low inside the pattern structure, or just below the midpoint of the high-volume breakout candle itself. If the stock falls back deep into the old pattern, the breakout thesis is instantly invalidated, and you must exit with a small, calculated loss.
The Profit Target Blueprint: Measure the vertical height of the widest part of the chart pattern (the base of the triangle or rectangle). Extrapolate that exact distance upward from the breakout point to establish your primary, mathematically sound take-profit target.
The Ultimate Chart Pattern Breakout Strategy Cheat Sheet
The stock market moves incredibly fast, and manually flipping through thousands of individual charts to locate building setups is an inefficient use of time. Professional technical analysis relies on configuring robust scanners and screeners to filter the entire market down to a highly targeted watchlist of breakout candidates before the opening bell rings.
Technical Parameters for Volatility Contraction Scans
To find stocks that are primed for an explosive chart pattern breakout, your scanner must filter for assets experiencing extreme volatility compression. You can easily configure these parameters into popular screening software like Finviz or platform engines like Chartink:
Consolidation Filtering: Scan for stocks whose prices have remained within a tight, horizontal percentage band (e.g., less than 5% or 10% range volatility) over the past 20 to 30 trading sessions.
Average True Range (ATR) Contraction: Filter for assets where the short-term ATR (such as a 5-day ATR) is significantly lower than the long-term historical ATR (a 50-day ATR). This statistical pinch proves that the stock's daily range is drying up, indicating that a massive structural expansion is imminent.
Moving Average Alignment: Look for daily charts where the 10-period, 20-period, and 50-period exponential moving averages are tightly coiled or completely flatlined together. This alignment occurs right at the apex of major triangle or wedge patterns, serving as a reliable indicator that the asset is ready to burst into a fresh trend.
Managing Your Breakout Watchlist
Once your custom scanner populates a raw list of candidates, review the charts to identify clean geometric boundaries and clear horizontal levels. Sort the final screeners by daily relative volume.
The stocks showing the tightest price compression on the lowest relative volume during consolidation are your top priorities. This indicates that the market has gone completely quiet and supply is thoroughly exhausted. When the subsequent volume spike hits these specific names, the resulting breakout is clean, rapid, and highly profitable.
If you want to master more high-velocity market events, check out our other comprehensive trading guides:
➡️VIX Trading Strategy Guide
➡️How to Trade Economic Data
➡️How to Trade Earnings Reports