
Trading Economic Reports: SPY Strategy for PCE & Home Sales (2026)
Master economic data trading with proven strategies for PCE and new home sales releases. Learn pre-market prep, execution plans, and how to trade SPY volatility in the first 30 minutes.
Economic Reports: Navigating the Macro Waves of Expected Volatility (2026)
Introduction: The Macro Pulse of Day Trading
At Smart Trades Zone, we don't treat economic data as "news." We treat it as a Liquidity Event. Whether it is the Personal Consumption Expenditures (PCE) index—the Federal Reserve's preferred inflation gauge—or New Home Sales data, these reports force institutional "Big Money" to re-price their entire outlook on interest rates and equity valuations in seconds. This playbook provides the definitive framework for trading these high-impact catalysts using the [SPY Intraday Playbook] as your primary execution vehicle.
In the modern market of 2026, day traders often get caught in the "micro" noise—watching every tick and 1-minute candle without understanding the massive waves moving the ocean. Economic reports are those waves. These pre-scheduled data releases from the Bureau of Economic Analysis (BEA) and the Federal Reserve are the primary drivers of "Expected Volatility".
Phase 1: The Heavy Hitters – Identifying Market-Moving Data
Not all economic reports are created equal. To avoid "analysis paralysis," focus on the "Big Three" that currently dictate market sentiment in 2026:
1. Personal Consumption Expenditures (PCE): This is the "Holy Grail" for the Fed. While retail traders obsess over CPI, the Fed uses PCE to decide if they will hike, hold, or cut rates. A "hot" PCE print (higher than the 2.8% projected average) triggers immediate fears of a hawkish Fed.
2. New & Existing Home Sales: In a high-interest-rate environment, housing data is a leading indicator of economic health. A surge in home sales suggests consumers are resilient despite mortgage rates hovering near 6.3%.
3. The FOMC & Jobs Reports (NFP): These set the broader trend. If the Fed remains steady at 3.50%–3.75%, the intraday reaction to PCE will be even more violent as traders look for any sign of a policy shift.
Phase 2: Pre-Release Preparation – Mapping the Levels
Successful economic trading starts at 8:00 AM EST, long before the data drops.
- Check the Consensus: Use your economic calendar to find the "Forecast" vs. "Previous" numbers. The market doesn't trade the actual number; it trades the "Surprise."
- Mark the "Sand in the Line": Identify key technical levels on SPY and QQQ. In early 2026, for example, SPY has shown major supply at the 701.00 level and demand at 692.50. These are your "Targets" and "Bails" once the data hits.
- Anticipate Scenarios: Ask yourself, "If PCE is hot, where is the first support level institutional buyers will step in?" To gauge the potential intensity of these moves, we cross-reference the [VIX fear index] to see if the market has already priced in the expected turbulence.
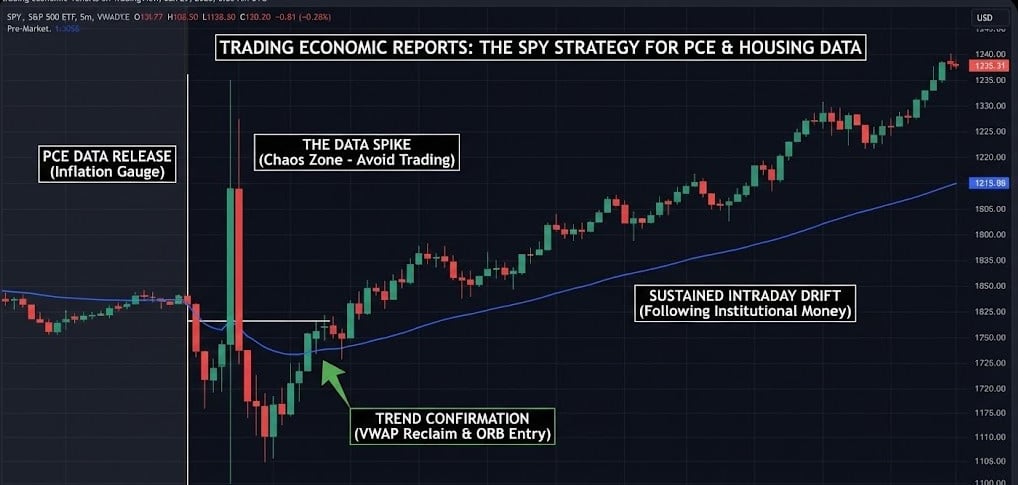
Phase 3: The 8:30 AM / 10:00 AM Chaos Zone
Most economic data is released at 8:30 AM (Pre-market) or 10:00 AM (30 minutes after the open).
- The "No-Trade" First 5 Minutes: When the data hits, liquidity often vanishes. Large buy and sell orders are pulled from the book as algorithms digest the numbers. This creates wide bid-ask spreads and "Whipsaws." Jumping in during the first 60 seconds is gambling, not trading.
- Watch the 10-Year Treasury Yield ($TNX): If a report is released and the 10-Year yield spikes, SPY will almost always drop. In 2026, the inverse correlation between yields and tech stocks is stronger than ever.
- Volume Confirmation: A valid reaction requires a massive surge in relative volume. If SPY moves 1% on low volume, it is likely a "Trap" that will be reversed by the afternoon.
Phase 4: The SPY Execution Blueprint
Once the "initial shock" has subsided, look for these three high-probability setups:
1. The Opening Range Breakout (ORB): If 10:00 AM data causes a spike, wait for the 10:30 AM candle close. If price breaks above the high of that volatility window, the "Drift" is usually higher for the rest of the day.
2. The VWAP Reclaim: Use the Volume Weighted Average Price (VWAP) as your "Institutional Anchor." If a report causes a crash but price quickly reclaims the VWAP and holds it as support, it signals that institutions are "Buying the News".
3. The "Fade the Extremes": If PCE comes in "Hot" and SPY drops 2% in 15 minutes, look for a "Double Bottom" at a major daily support level.
Phase 5: Risk Management – The Professional's Edge
Economic reports are account-killers for the undisciplined. You must adjust your rules:
- Position Sizing (The 50% Rule): Because the volatility (ATR) is expanded, you should trade with half your normal size. Use our [Position Sizing Mastery] formulas to adjust your risk dynamically before the data hits the tape.
- Hard Stops Only: Never use "mental stops" during news. Price can skip levels, and you need a hard order in the system to prevent a catastrophic loss.
- The "Three Strikes" Rule: If you get "chopped out" (stopped out) three times during a news reaction, walk away.
Phase 6: Psychology – Trade the Reaction, Not the Data
The biggest mistake retail traders make is trying to be "Economic Geniuses." They read a "Good" report and buy, only to see the stock market tank.
Rule: "The market is never wrong; your interpretation is."
If PCE is "Good" but SPY is red, it means the news was already "Priced In," or there is a hidden detail in the report that the market dislikes. Trade the price action on your screen, not the thesis in your head.
Summary: Mastering the Macro Cycle
Trading economic reports like PCE and Home Sales is about discipline, timing, and technical confluence. By preparing your levels pre-market, avoiding the initial chaos, and reacting only to confirmed institutional footprints, you turn these volatile events into your most profitable days.