
How to Trade Tesla Options: Q2 Earnings Playbook & Levels
Master your Tesla options trading through the Q2 earnings release. Get precise $TSLA stock day trading levels, IV crush strategies, and hard risk rules.
OPTIONS TRADING
How to Trade Tesla Options:
2026 Earnings Playbook & Strategy
Tesla Earnings Date, Call Time, and Release Details:
The upcoming tech earnings sequence is officially kicking into gear, and Tesla is stepping directly into the spotlight. As retail options traders hunt for volatile short-duration plays, aligning your execution with the exact logistical timeline is critical to avoid getting caught on the wrong side of sharp after-hours spreads.
Q2 2026 Tesla Earnings: The Logistics Countdown:
Tesla Earnings Date 2026: Wednesday, July 22, 2026.
TSLA Earnings Call Time: The live question-and-answer webcast begins promptly at 5:30 PM ET.
Tesla Earnings Release Schedule: The official quarterly update report is scheduled to cross the wires immediately after the market close, expected around 4:05 PM ET.
Conference Call Format: Live executive broadcast featuring a direct strategic Q&A session with Elon Musk and Tesla's senior leadership team.
Webcast Access: Streamed live through the corporate investor relations portal.
Baseline Market Expectations & Core Estimates:
Consensus EPS (Non-GAAP): Wall Street analysts are targeting a baseline print of $0.47 per share.
Consensus Revenue Target: Anticipated at $25.64 billion, representing a modest +13% expansion Year-over-Year.
Vehicle Deliveries Benchmark: Reported earlier on July 2 at 384,000 vehicles, tracking noticeably below the original consensus target of 406,000.
Full-Year Fiscal Outlook: The annual consensus EPS projection sits at $2.12, pinning the equity's forward Price-to-Earnings (P/E) multiple at an aggressive ~190x at current market valuations.
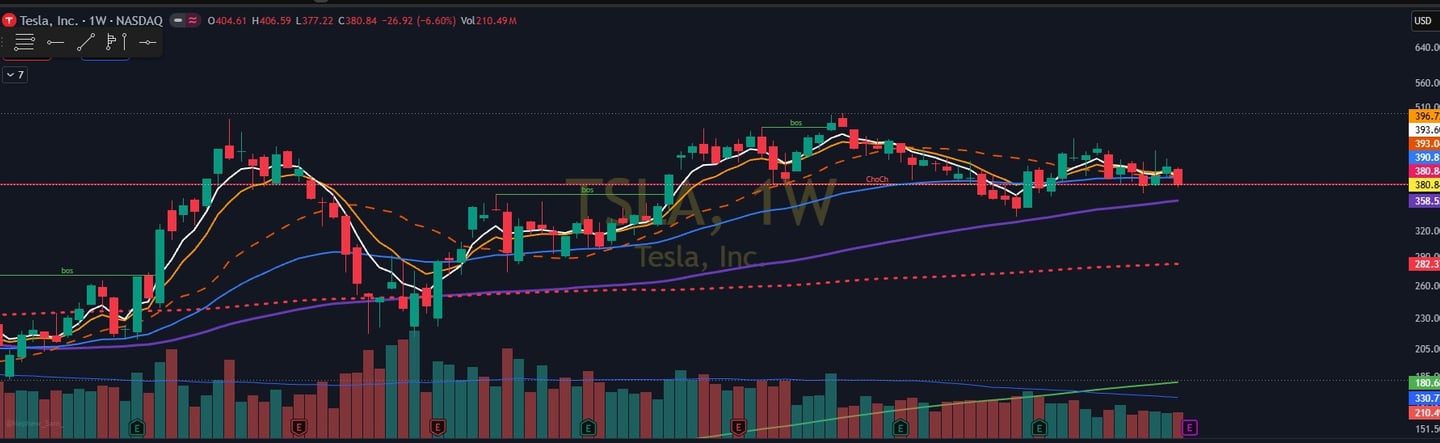
Price Position Heading In: The stock finished the last session at $380.84, down roughly 7% Year-to-Date as broad-market rotational pressure weighs on tech.
Consensus Analyst Price Target: Hovering around ~$407, implying a conservative near-term upside pocket if operational execution matches expectations.
Major Structural Overhangs & Underlying Realities:
The underlying fundamental pressures clouding the immediate price action stretch well beyond standard manufacturing output. Institutional desks are hyper-focused on persistent automotive gross margin compression stemming from recent global vehicle price cuts, alongside aggressive localized competition from overseas EV manufacturers. Furthermore, capital expenditures surrounding the ongoing Cybertruck production ramp, timeline shifts for the upcoming Robotaxi rollout, and the broader macro narrative frequently tied to Elon Musk's public profile continue to introduce layers of option premium risk. Because the stock commands a premium multiple, any signs of extended margin deterioration could trigger institutional capital de-risking regardless of revenue top-line stability.
The Tactical Setup: Lowering the Fundamental Bar:
Tesla has already delivered an early warning shot by disappointing on its historical delivery numbers, meaning the absolute bar for performance has been lowered significantly heading into Wednesday afternoon. However, the exact post-market reaction to this report will be heavily judged on realized margins and forward-looking guidance rather than backward-looking delivery metrics. A minor beat on EPS paired with soft or ambiguous future targets will likely send the stock trailing lower as institutions look to hedge broad-market risk. Conversely, a modest miss on the bottom line that is salvaged by definitive, highly optimistic commentary regarding Full Self-Driving (FSD) software monetization or explicit autonomous taxi milestones could instantly ignite a massive short squeeze.
How to Day Trade Tesla Stock (Pre-Earnings Key Levels)
TSLA finished the last session at $380.84, down 2.82% on the day and sitting heavily near the lower boundary of its recent trading range. With the highly anticipated corporate earnings report dropping Wednesday after the close, Monday and Tuesday represent your primary pre-positioning windows. Understanding where historical liquidity rests on the chart allows you to execute precise intraday scalps without getting caught in choppy, directionless noise.
Daily Chart: Macro Structural Levels:
For larger swing targets and position management, these are the primary daily lines in the sand to map out before the opening bell:
Major Support 1 ($380.15): Tracks directly with Friday's close zone and serves as your very first structural line of defense.
Major Support 2 ($368.60): A critical 3-touch swing low established three weeks ago that acts as the ultimate line in the sand for bulls.
Period Low ($337.24): Represents a significant 82-bar extreme low, acting as the primary downside flush target if corporate earnings severely disappoint.
Previous Day High / PDH ($385.69): Friday's high, standing as your immediate overhead line of minor resistance.
Major Resistance 1 ($396.23): A distinct 3-touch swing high cutting back 16 weeks into chart history.
Minor Resistance ($414.75): A single-touch structural swing high carved out four weeks ago.
Major Resistance 2 ($416.00): A massive overhead supply block defined by 6 separate historical touches, forming a major ceiling.
Major Resistance 3 ($432.86): A prominent 5-touch swing high from two weeks ago that establishes the pre-earnings upper bound.
Period High ($453.40): An 82-bar high watermark that serves as the ultimate macro breakout target on a blowout earnings report.
Intraday Session Key Execution Levels:
When drilling down to the 3-minute execution chart for active day trading on Monday and Tuesday, keep these high-traffic price pockets locked on your screen:
Previous Day Low / PDL ($377.22): Friday's exact low. An intraday break below this level serves as a definitive bearish pre-earnings signal.
First Resistance Pocket ($380.31): A hyper-sticky intraday level marked by 11 distinct touches during the last regular session.
Previous Day Close / PDC ($380.84): Friday's closing print, acting as your baseline psychological pivot for the session.
Major Intraday Resistance Wall ($381.97): A massive institutional supply zone anchored by 45 individual intraday touches.
Opening Range Low ($384.06): The exact baseline low established during Friday's initial morning opening range.
Opening Range High ($387.25): The clean ceiling of Friday's initial opening range. Reclaiming this zone establishes an immediate bullish setup.
The Pre-Earnings Day Trading Playbook:
Tesla is tightly coiling within a broad multi-week structure between $368 and $433, with immediate price action compressed inside a narrow band from $377 to $386. Because the latest close at $380.84 pins price directly on top of the $380.15 major support, this exact price pocket stands as your absolute macro inflection point.
The Bullish Intraday Execution Framework:
Primary Entry Zone: Look for entries between $380 and $381, strictly requiring a verified intraday hold above the $380.15 major support line.
First Target Milestones: Target a quick scaling move toward $385.69 (Previous Day High) followed by $387.25 (Opening Range High).
Secondary Target Milestones: Look to hold a runner toward $396.23 if broad market tech momentum expands.
Hard Invalidation Line: Any definitive intraday close below $377.22 (Previous Day Low) completely kills the long momentum, indicating that buyers have abandoned the floor ahead of the print.
The Bearish Intraday Execution Framework:
Primary Entry Zone: Look to fade the asset on a clean, lower-timeframe rejection at the $381.97 heavy intraday wall or directly against the $385.69 overhead high.
First Target Milestones: Target a rapid downside scalp back into the $377.22 support low.
Secondary Target Milestones: Look to scale deeper out of the trade toward the $368.60 daily support floor.
Hard Invalidation Line: A clean breakout and sustained hold above $387.25 on high relative volume invalidates the short bias instantly.
Tactical Bottom Line:
Pre-earnings day trades on volatile megacaps are pure momentum plays, not speculative bets on the underlying corporate numbers. You are strictly trading the strategic asset drift into Wednesday's print, meaning you must size down and utilize invariant hard stops to protect capital. The zone between $380.15 and $377.22 is your ultimate dashboard checkpoint—if the stock finds itself languishing deep inside this trapdoor on Tuesday afternoon, the technical tape is flashing an explicit warning sign before the actual press release crosses the wire. Keep your execution simple: holding above $380 opens a clean path toward $396, while losing $377 triggers an immediate flush to $368. Everything else is uncompromised noise.
How to Trade Tesla Options Through the Release
Corporate earnings drop on Wednesday after the closing bell, which means the July 24 expiration contract—the Friday expiration landing just two trading days after the print—serves as your primary options trading vehicle. Executing positions inside this ultra-short-duration window demands a strict understanding of premium dynamics if you want to avoid getting completely slaughtered by an overnight volatility collapse.
The Implied Volatility Environment:
Options market makers are pricing in a massive premium ahead of the announcement. Here is where underlying options metrics stand based on the latest weekend metrics:
At-The-Money (ATM) Strike Floor: Set exactly at $380.
$380 Strike Call Mid Price: Trading at $13.98 per contract.
$380 Strike Put Mid Price: Trading at $12.85 per contract.
ATM Straddle Benchmark Cost: Standing at ~$26.83.
Realized Implied Move: Market makers are pricing a ~7% absolute swing in either direction off the $380 pivot, establishing an expected post-earnings target range between $353 on the downside and $407 on the upside.
ATM Call Implied Volatility (IV): Sitting at a highly elevated ~71%.
ATM Put Implied Volatility (IV): Sitting at ~66.5%.
Implied Volatility Skew: Calls are tracking noticeably more expensive than puts, confirming that short-term retail market participants are leaning structurally bullish.
To achieve a true breakeven on an unhedged long straddle, you require the underlying equity to move a minimum of $27 in either direction by Friday. Any realized post-market move beneath that 7% threshold means time decay and volatility contraction will rapidly drain your contract value.
Strike Selection Parameters for Directional Plays:
If you choose to bypass multi-leg spreads to trade raw direction, selecting your strikes with a firm grasp of underlying delta and breakeven boundaries is mandatory.
Bullish Long Call Options Metrics:
$375 Strike Call: Trading at a mid price of $16.63 with a 0.58 Delta and 70.3% IV. Requires an absolute upside breakeven price of $391.63. Open interest currently holds at 317 contracts.
$380 Strike Call: Trading at a mid price of $13.98 with a 0.52 Delta and 71.0% IV. Requires an absolute upside breakeven price of $393.98. Open interest currently holds at 802 contracts.
$385 Strike Call: Trading at a mid price of $11.68 with a 0.46 Delta and 69.8% IV. Requires an absolute upside breakeven price of $396.68. Open interest currently holds at 681 contracts.
$390 Strike Call: Trading at a mid price of $9.65 with a 0.41 Delta and 70.0% IV. Requires an absolute upside breakeven price of $399.65. Open interest currently holds at 1,739 contracts.
$400 Strike Call: Trading at a mid price of $6.40 with a 0.30 Delta and 69.5% IV. Requires an absolute upside breakeven price of $406.40. Open interest currently commands a heavy 7,439 contracts.
Bearish Long Put Options Metrics:
$385 Strike Put: Trading at a mid price of $15.55 with a -0.54 Delta and 65.3% IV. Requires a downside breakeven price of $369.45. Open interest sits at 1,354 contracts.
$380 Strike Put: Trading at a mid price of $12.85 with a -0.48 Delta and 66.5% IV. Requires a downside breakeven price of $367.15. Open interest sits at a thick 3,921 contracts.
$375 Strike Put: Trading at a mid price of $10.48 with a -0.42 Delta and 65.6% IV. Requires a downside breakeven price of $364.52. Open interest sits at 2,694 contracts.
$370 Strike Put: Trading at a mid price of $8.38 with a -0.36 Delta and 66.2% IV. Requires a downside breakeven price of $361.62. Open interest commands a substantial 6,466 contracts.
Demystifying the Implied Volatility Crush Trap:
What routinely damages retail options traders on earnings nights is a complete failure to respect volatility contraction. Imagine purchasing a single naked $380 strike call at a premium of $14. The company delivers a solid earnings beat on Wednesday afternoon and the stock immediately gaps up 4% to trade at $396 on Thursday morning.
While you may assume your trade is significantly in the green, implied volatility will collapse from its pre-earnings 71% high down toward a normalized 40% floor overnight. This severe drop in Vega pricing can cause your call's value to contract to $8 despite the underlying equity trading higher, forcing an immediate 43% net loss on a structurally winning directional thesis. Because market makers require an outsized 7% move to break even on naked long options, any gap smaller than that target turns your contract into a losing trade.
High-Probability Option Strategies That Survive Volatility Crush:
To trade this high-stakes catalyst without exposing your account to systemic volatility contraction, shift your execution away from unhedged options and utilize multi-leg risk-defined setups.
Vertical Debit Spreads (Best for Explicit Directional Conviction):
The Bull Call Spread: Buy the $380 Strike Call and simultaneously sell the $390 Strike Call for a net debit entry near ~$4.33. This caps your absolute maximum risk at $433 per contract while paving a path to a $5.67 maximum profit milestone, establishing a highly accessible breakeven target at ~$384.33. By shorting the inflated $390 premium, you insulate your long option against severe volatility contraction.
The Bear Put Spread: Buy the $380 Strike Put and simultaneously sell the $370 Strike Put for a net debit entry near ~$4.47. This caps your absolute risk at $447 while capturing a maximum profit target of $5.53 with a highly achievable breakeven line at ~$375.53.
Vertical Credit Spreads (Best for Exploiting Premium Overpricing):
The Out-Of-The-Money Bear Call Spread: Sell the $400 Strike Call and buy the $410 Strike Call to harvest a net credit near ~$3.50. You retain this entire premium as pure profit if the underlying stock finishes the week beneath the $400 ceiling, allowing the post-earnings volatility crush to act as an immediate tailwind for your position.
The Out-Of-The-Money Bull Put Spread: Sell the $360 Strike Put and buy the $350 Strike Put to harvest a net credit near ~$2.75. This trade yields full profitability as long as price action successfully defends the structural floor above $360.
The Iron Condor (Best for Capitalizing on Range Consolidation):
The Execution: Combine an OTM bear call spread and an OTM bull put spread by selling the $400 Call / buying the $410 Call alongside selling the $360 Put / buying the $350 Put. Collecting an aggregate total net credit near ~$6.25, you lock in maximum profit if the asset settles comfortably inside a defined $360 to $400 range through Friday's close, banking on the thesis that market makers have vastly overestimated the true move.
Operational Rules for Capital Survival:
Avoid Naked At-The-Money Bets: Refuse to purchase unhedged ATM calls or puts at inflated premiums of $14 to $15. The underlying asset must clear a brutal 7% boundary just to break even, rendering the raw risk-to-reward parameters highly unfavorable.
Disregard Out-of-the-Money Lotteries: Avoid purchasing highly speculative, cheap lottery tickets like the $450 or $500 strike calls. Despite high open interest readings showing thousands of retail traders throwing capital at these strikes, options math ensures these vehicles almost always expire completely worthless.
Honor the Thursday Time Stop: The July 24 options contract expires on Friday, meaning time decay (theta) will accelerate at an extreme pace throughout Thursday's session. If your long directional exposure hasn't materialized a massive move by Thursday afternoon, cut the position immediately to preserve remaining premium.
Size for Fixed Risk Boundaries: Prioritize defined-risk credit or debit spreads over raw options premiums. A single vertical debit spread established at $4.33 defines your maximum downside risk at exactly $433 per contract. Structure your total position size entirely around that max loss capability, not your direction.
Execute Precise Profit Targets: If a multi-leg option spread achieves 50% of its total maximum profit milestone by Thursday afternoon, execute an immediate exit. Do not leave your capital exposed to late-week assignment risks just to squeeze out the final remaining cents of premium.
Post-Earnings Execution Scenarios & Risk Rules
Corporate earnings drop Wednesday after the closing bell, which makes Thursday morning your primary execution window. The initial post-earnings reaction is incredibly volatile, meaning your job is not to guess the print, but to systematically trade the realized market reaction.
Scenario 1: Beat + Strong Guidance (Bullish Setup):
This scenario materializes if Tesla beats the $0.47 consensus EPS projection and actively raises forward-looking delivery or profit margin guidance. If this occurs, the stock will likely gap up out of its regular trading range.
Execution Strategy for an Opening Gap Above $396.23: Do not chase the initial opening print. Wait patiently for the first 15-minute candle to close to see if institutional buyers are defending the gap.
The Entry Trigger: If the first 15-minute candle successfully closes and holds above $396, look for a long entry or call option buy on a retest of the $396–$397 zone.
Risk Mitigation Parameters: Place a hard stop order on an intraday close beneath $391, which aligns with Friday's previous structural pivot.
First Target Milestone: Take a partial 50% profit at $416, which marks a significant daily resistance level reinforced by 6 separate historical touches.
Second Target Milestone: Complete your exit and lock in the remaining position at $432.86, targeting a prominent 5-touch major resistance ceiling.
Execution Strategy for an Outsized Gap Above $416: Avoid chasing an extreme move. Wait for an intraday pullback to materialize into the $410–$416 support zone, looking for an entry only after the level is reclaimed with volume, placing a hard stop directly under $405.
Core Bullish Risk Rule: If the opening gap expands past the market's implied 7% move (pushing north of ~$407), the premium is already over-exhausted. Wait for a definitive morning low to form first. If the initial 15-minute candle prints a red hammer or an aggressive rejection tail at the highs, the gap is highly likely to fade—keep your hands off the buy trigger.
Scenario 2: Miss or Weak Guidance (Bearish Setup):
This scenario unfolds if Tesla misses quarterly consensus figures or issues soft forward-looking projections regarding the Robotaxi or vehicle margins. This will likely trigger a sharp opening gap down.
Execution Strategy for an Opening Gap Below $377.22: Do not short the initial opening flush. Allow the first 15-minute candle to close to avoid getting trapped in an aggressive, algorithmic dead-cat bounce.
The Entry Trigger: If the first 15-minute candle closes definitively under $377, execute a short position or buy puts on a retest of the $377–$380 zone.
Risk Mitigation Parameters: Place a hard defensive stop order on an intraday close above the $385.69 previous day high.
First Target Milestone: Cover 50% of your position at $368.60, which serves as a major 3-touch daily support floor.
Second Target Milestone: Scale entirely out of the remaining short position as price enters the $350–$353 market-maker implied move target zone.
Execution Strategy for an Outsized Gap Below $368: Do not chase the short at extreme lows. Wait for a relief bounce back toward the $368–$372 zone. Look to enter short on a verified lower-timeframe rejection, setting your hard stop order above $377.
Core Bearish Risk Rule: An opening miss that flushes beneath the implied move floor at $353 indicates a highly oversold opening conditions. Give the tape 15 minutes to settle. If price action stabilizes and holds above $350, the initial structural flush is likely exhausted—refuse to pile into fresh short exposure at those depths.
Scenario 3: In-Line / Sideways Reaction (No-Trade Setup):
This scenario plays out if the earnings report matches baseline consensus metrics, offering no major surprises while forward-looking guidance remains completely neutral. The stock will open directly within its established trading range.
Execution Strategy for an Opening Print Between $377 and $386: Keep your hands off the keyboard for the first 30 minutes of the regular session. Allow early liquidity matching to clear.
The Upside Trigger: If price prints a clean, high-volume breakout above the $387.25 opening range high later in the morning, execute a long position with a hard stop placed beneath $382.
The Downside Trigger: If price action prints a high-volume breakdown beneath the $377.22 previous day low, execute a short position with a hard stop anchored above $381.
The Avoidance Rule: If the asset spends the morning chopping randomly between $380 and $385, walk away entirely. This is an institutional no-trade zone designed to burn premium through theta decay.
The Iron Rules for Thursday's Opening Bell:
Rule 1: Honoring the 15-Minute Candle Close: This parameter is absolute and non-negotiable. The first 15 minutes of regular session price action following an earnings release is an uncompromised mix of institutional block repricing, retail panic, and rapid algorithmic gap-filling. The 9:45 AM ET candle close serves as your very first reliable structural signal.
Rule 2: Never Chase an Opening Gap: If the stock opens up 8% and your account did not hold a position through the print, you missed the trade. Purchasing an equity gap that has already stretched completely past its implied move parameters is a primary cause of catastrophic account drawdown. Sit back and wait for a structured retest.
Rule 3: Reduce Baseline Sizing by 50%: Post-earnings volatility runs 2 to 3 times hotter than a standard trading session. A standard position size can take an outsized loss within the opening hour of trading. Protect your capital equity by cutting your position size in half or utilizing fixed-risk options spreads instead of raw stock.
Rule 4: Hard Stops Over Mental Stops: Manually enter your protective stop-loss order into your platform before your entry order fills. High-velocity post-earnings expansions do not grant you the time to sit back and ponder an exit. If the underlying price hits your predetermined risk line, you are out of the trade immediately.
Rule 5: The First Hour Rule: The initial 60 minutes of the trading day are designed for immediate tactical execution, not macro trend formation. If your charts fail to trigger a clear entry by 10:30 AM ET, you are no longer day trading. Adjust your operational mindset or flatline the position.
Rule 6: Adhering to Option Expiration Guidelines: If you are holding short-duration vertical spreads through the earnings print, your exit framework remains completely unchanged. If your spread achieves 50% of its total maximum profit milestone by Thursday afternoon, take your money off the table. Never hold short-duration spreads until the final bell hoping to extract the remaining pennies.
Post-Earnings Execution Quick Reference Blueprint:
Standard Bullish Reaction Profile: If price gaps above $396, wait 15 minutes for structural validation. Look to buy a retest of the $396–$397 zone, placing a hard protective stop on an intraday close beneath $391.
Outsized Bullish Reaction Profile: If price gaps aggressively above $416, wait for a structural pullback. Look to buy a verified reclaim of the $410–$416 band, setting a hard stop order beneath $405.
Standard Bearish Reaction Profile: If price gaps down below $377, wait 15 minutes for the range to settle. Look to short a retest of the $377–$380 zone, placing a hard protective stop on an intraday close above $386.
Outsized Bearish Reaction Profile: If price gaps aggressively below $368, wait for an intraday relief bounce. Look to short a clear rejection of the $368–$372 zone, setting a hard stop order above $377.
Chop and Sideways Reaction Profile: If price opens stuck between $377 and $386, sit on your hands for the first 30 minutes. Look to trade a high-volume breakout or breakdown past either extreme of the range, placing your stop at the opposite end of the daily boundary.
FAQ: Tesla Q2 2026 Earnings
1. What time does Tesla report Q2 2026 earnings?
Earnings Date: Wednesday, July 22, 2026.
Report Release Schedule: Tesla will release its official Q2 financial results immediately after the market close, at approximately 4:05 PM ET.
Conference Call Start Time: The live audio webcast featuring senior Tesla leadership begins promptly at 5:30 PM ET.
How to Access: Active market participants can stream the call live through the corporate webcast link on Tesla's official investor relations portal at ir.tesla.com.
2. What are the analyst expectations for Tesla's Q2 earnings?
Wall Street consensus has established definitive baseline targets heading into the release, though the absolute performance bar has already been altered by early automotive data:
Consensus Adjusted EPS: Projected at $0.47 per share (Non-GAAP).
Consensus Revenue Target: Anticipated at $25.64 billion, representing a +13% expansion Year-over-Year.
Vehicle Deliveries Benchmark: Tesla already reported official Q2 delivery volume at 384,000 vehicles back on July 2, tracking visibly beneath the original institutional street target of 406,000.
The Strategic Focus: Because top-line delivery metrics are already largely baked into the price action, institutional desks are focusing almost entirely on underlying automotive gross margins and forward-looking guidance rather than a standard headline beat or miss.
3. How much is Tesla stock expected to move after earnings?
Implied Move Parameters: The options market is currently pricing in an aggressive 7% absolute swing in either direction off the regular session close, translating to a substantial $27 price variance.
Options Straddle Cost: The At-The-Money (ATM) July 24 options straddle demands a premium of roughly $27 per contract.
Breakeven Boundaries: To avoid immediate losses on naked long options positions, the underlying stock must violently expand past $407 on the upside or flush beneath $353 on the downside by Friday's expiration.
The Volatility Risk Factor: Any realized post-market move that lands within that implied 7% boundary will trigger an immediate, overnight implied volatility collapse. This extreme IV crush will rapidly drain premium out of long option contracts, which is precisely why multi-leg vertical spreads and risk-defined credit strategies structurally outperform unhedged options buying through the print.
4. Should I buy Tesla stock before earnings?
Deciding whether to deploy capital ahead of the announcement depends entirely on your operational trading timeframe and structural risk tolerance:
Intraday Day Trading Rules: If you are strictly looking to trade the asset's momentum drift on Monday or Tuesday, trade the clear technical lines. Focus on $380 as your baseline session pivot, $377 as your core line in the sand, and $396 as your primary overhead resistance target.
Holding Through the Print: Maintaining exposure through Wednesday afternoon means accepting a binary, high-velocity 7%+ overnight gap that can break aggressively in either direction on an underlying stock that enters the week already down 7% Year-to-Date.
Position Sizing Mandate: If you choose to hold a position through the announcement, proactively cut your standard trade sizing in half to insulate your account against severe after-hours slippage. Always enforce hard stop-loss orders directly in your platform.
The Tactical Alternative: If you do not maintain a definitive, data-supported thesis regarding whether Tesla will beat or miss margin expectations, do not gamble capital on the call. Sidestep the overnight volatility trap entirely and execute clean, tape-validated setups on the regular session reaction Thursday morning instead.