
Moving Average Strategies: Trade with the Trend for Profits
Master the 20/50/200 EMA system for trend trading. Learn moving average crossovers, dynamic support/resistance, and how to ride momentum for consistent profits in any market condition.
Moving Average Strategies: Mastering Institutional Gravity (2026)
Introduction: The Pulse of the Market
At Smart Trades Zone, we use Moving Averages (MAs) to filter out that noise and reveal the true pulse of the market. A moving average is a lagging, trend-following indicator that smooths out price data by creating a constantly updated average price. It acts as a compass, telling you which way the institutional "river" is flowing. This playbook will move you beyond simply watching a line on a chart to mastering the 20/50/200 EMA system for professional-grade trend trading.
In the chaotic world of 1-minute candles and flashing red and green numbers, traders often lose sight of the "big picture." They get caught in the "noise" of minor price fluctuations and end up trading against the primary momentum of the market. At Smart Trades Zone, we use Moving Averages (MAs) to filter out that noise and reveal the true pulse of the market.
A moving average is a lagging, trend-following indicator that smooths out price data by creating a constantly updated average price. It acts as a compass, telling you which way the institutional "river" is flowing. This playbook will move you beyond simply watching a line on a chart to mastering the 20/50/200 EMA system for professional-grade trend trading.
Phase 1: SMA vs. EMA—Choosing Your Weapon
Not all moving averages are created equal. The two most common types serve very different purposes:
1. Simple Moving Average (SMA): This calculates the arithmetic mean of prices over a set period (e.g., the last 50 days). It gives equal weight to all data points. It is slower to react but provides a very stable look at long-term trend analysis.
2. Exponential Moving Average (EMA): This assigns more weight to recent price data. Consequently, it reacts much faster to current market changes.
The Smart Trades Rule: Day traders and scalpers typically prefer EMAs because they need fast signals for quick entries and exits. Swing traders often rely on SMAs for their smoother, more reliable long-term trend identification.
Phase 2: The "Big Four" Periods
While you can set a moving average to any number, millions of institutional traders watch these specific periods, turning them into self-fulfilling prophecies:
- 9 EMA: Used for ultra-short-term momentum and scalping.
- 20 EMA: The "gold standard" for short-term trend and pullback entries.
- 50 SMA/EMA: The primary gauge for medium-term trend direction.
- 200 SMA: The "God Line." This represents the long-term health of the stock. If a stock is above its 200 SMA, it is in a long-term bull market; below it, a bear market.
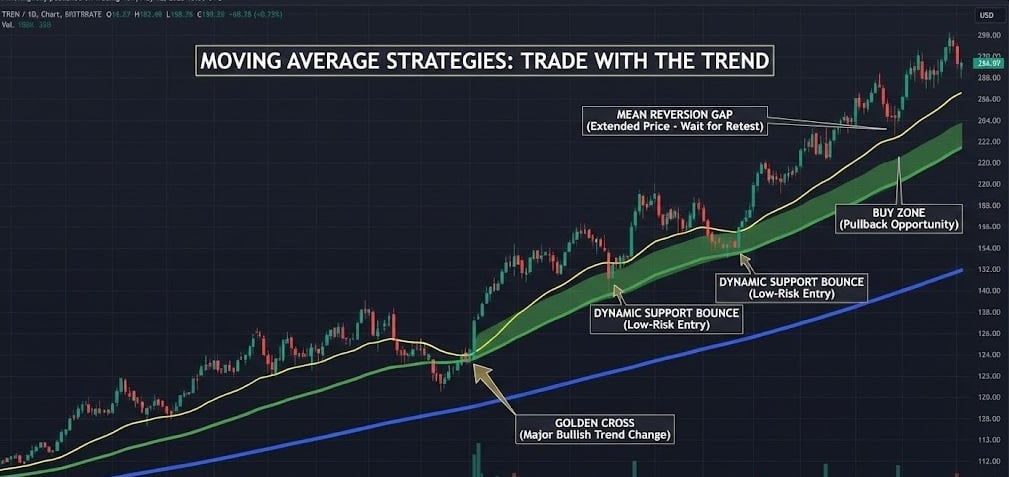
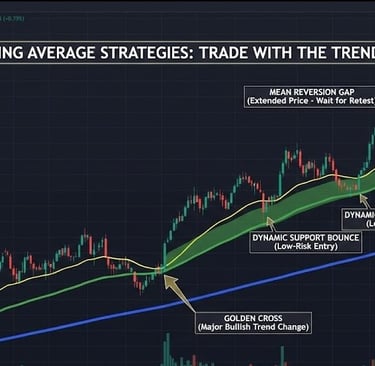
Phase 3: The Crossover Strategy—Golden and Death Crosses
Crossovers occur when a shorter-term moving average crosses a longer-term one, signaling a major shift in momentum:
- The Golden Cross: When the 50 SMA crosses above the 200 SMA. This is a major bullish signal indicating a new long-term uptrend is beginning.
- The Death Cross: When the 50 SMA crosses below the 200 SMA. This signals bearish pressure and the potential start of a long-term decline.
- Dual Moving Average System: Many traders use a 20 and 50 EMA combo. You enter when the 20 crosses the 50 in the direction of the trend and exit when it crosses back. This systematic approach is a key component of the [SPY Intraday Playbook], helping traders stay on the right side of the daily trend.
Phase 4: Moving Averages as Dynamic Support and Resistance
In a strong trend, price rarely touches horizontal support levels. Instead, it "bounces" off moving averages. Unlike the static levels discussed in our [Support & Resistance Playbook], moving averages move with the price, providing "dynamic" areas of interest.
- Dynamic Support (Uptrends): During uptrends, price tends to bounce off the 20 or 50 EMA. These pullbacks offer low-risk entry opportunities for traders who missed the initial move.
- Dynamic Resistance (Downtrends): In downtrends, the moving averages act as a ceiling. Short entries near the MA provide favorable risk-reward setups as selling pressure increases at these levels.
Phase 5: The Mean Reversion Concept (The Rubber Band)
A critical but often overlooked aspect of moving averages is "Mean Reversion." Price can only move so far away from its average before it is pulled back like a rubber band.
- Overextension: When you see a massive gap between the price and the 20 EMA, the stock is "extended." Buying at this point is high-risk.
- The Snap-Back: Eventually, the stock will either trade sideways or drop back to touch the average. Professionals wait for this "re-test" of the average to enter, rather than chasing a vertical move.
Phase 6: Advanced Strategies—Bounces and the EMA Fan
- The Bounce Strategy: Experienced traders don't wait for crossovers. They identify a trend using the 200 SMA, wait for a pullback to the 20 or 50 EMA, and enter when a strong rejection candle (like a pin bar) appears.
- The EMA Fan: When the 9, 20, 50, and 200 EMAs are stacked in order and fanning out, it indicates a "Super-Trend." As long as the fan remains open, the trend is healthy. When the lines begin to "tangle" or converge, the trend is ending.
- VWMA (Volume-Weighted Moving Average): This incorporates volume data, giving more importance to price levels with high institutional activity. It tells you where the "weighted" average of the money is moving.
Phase 7: Common Mistakes and Risk Management
- Chasing the Crossover: Crossovers are lagging signals. By the time the 50 crosses the 200, a large portion of the move may already be over. Always confirm with price action.
- Over-Indicator Clutter: Using too many moving averages creates confusion rather than clarity. Stick to 2–3 maximum.
- Ignoring the Context: Moving averages work best in trending markets. In a sideways/ranging market, MAs will give constant false "whipsaw" signals.
- Precise Stop Losses: Because moving averages provide clear "zones" of failure, we use [Position Sizing Mastery] to calculate exactly where our trade is invalidated. If a bounce off the 50 EMA fails and closes below the line, the trade is dead.
Phase 8: The Psychology of the Lag
Many traders abandon moving averages because they "lag" behind the current price. This is a mistake. The lag is actually a feature, not a bug. It prevents you from jumping into every minor price flicker. It forces you to wait for a sustained change in the average price, ensuring you are trading with the true momentum of the "big money." By the time a moving average turns up, the probability of the trend continuing is mathematically higher.
Phase 9: Practical Tips for Success
- Multiple Timeframe Confirmation: If you see a 50 EMA bounce on the 15-minute chart, check if it aligns with a major level on the Daily chart.
- Convergence Zones: The most powerful setups occur when multiple moving averages (e.g., the 50 and 200) converge at the same price level alongside a horizontal support zone. This is a "Confluence Zone" and represents a high-probability trade.
- Combine with Volume: Never rely solely on the line. A bounce off the 50 EMA is only valid if it is accompanied by increasing buy volume.
Summary: Trading with the Wind at Your Back
Moving averages are the foundation of trend trading. They allow you to stop fighting the market and start riding the momentum. By mastering the 20/50/200 system, you ensure that you are always trading in the direction of institutional capital. Believe the average, follow the trend, and let the noise fade away.