
Candlestick Patterns Guide: Master Candlestick Trading Signals
Master Candlestick patterns for precision entries. Learn hammers, engulfing patterns, dojis, shooting stars to read market psychology and time your trades perfectly.
Candlestick Pattern Guide: Reading the Anatomy of Rejection (2026)
Introduction: The Language of the Battle
At Smart Trades Zone, we don't just "memorize" 50 different patterns. We teach you to read the "anatomy" of the candle. By understanding what the wicks and bodies represent, you can spot high-probability reversals before they appear on any lagging indicator. This playbook is your field guide to identifying when the "Smart Money" has shifted the momentum and when the "Weak Hands" are about to be folded.
While moving averages show you the trend and volume shows you the fuel, candlesticks show you the psychological state of the traders in the trenches. Every single candle is a story of a battle between bulls (buyers) and bears (sellers). The open, high, low, and close of a candle are not just numbers; they are historical markers of where one side gained ground and where the other side retreated in shame.
Phase 1: The Anatomy of a Candle – The DNA of Price Action
To master candlesticks, you must move beyond simple shapes and understand the three core components:
1. The Body: This represents the distance between the open and the close. A large, expansive body indicates high conviction. If the body is green and large, the bulls didn't just win; they dominated.
2. The Wicks (Shadows): These represent "Price Rejection." A long upper wick means the bulls tried to push the market up, but the bears slammed it back down. A long lower wick means the bears tried to crash the market, but buyers stepped in aggressively.
3. The Color: Green (or white) means the bulls won the session; Red (or black) means the bears took the trophy.
Phase 2: The Psychology of the Wick – Why Rejection Matters
The wick is the most honest part of the candlestick. While the body tells you who won the day, the wick tells you who lost control. If you see a stock in a strong uptrend that suddenly prints a candle with a massive upper wick, it means the "Smart Money" has stopped buying and has started providing the "exit liquidity" for the retail traders who are buying the hype. This rejection of higher prices is often the first signal to consult your [Support & Resistance Playbook] to see if the price has hit a major institutional ceiling.
Phase 3: The "Big Three" Reversal Patterns
We focus on the patterns that have the highest statistical probability of success, especially when they occur at major "Zones of Interest."
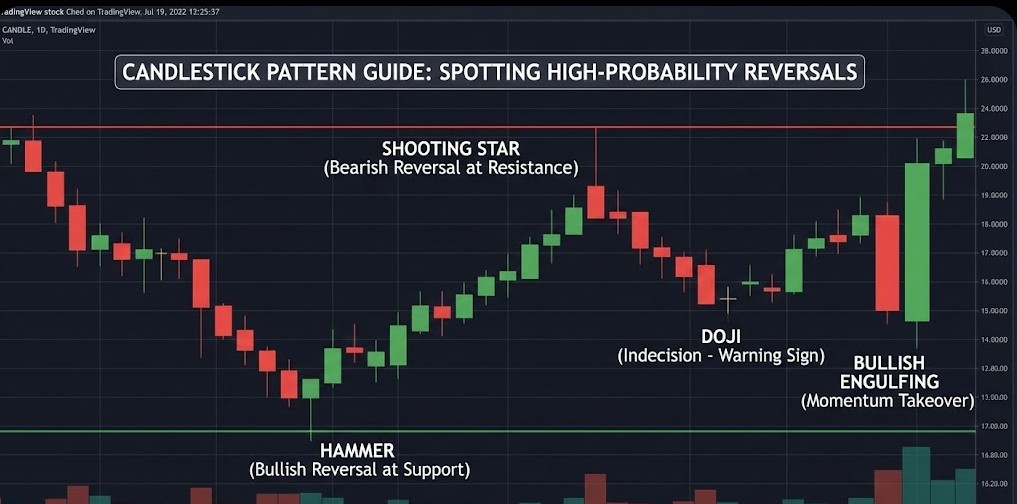
1. The Hammer (Bullish Reversal): Look for a small body at the top of the candle with a long lower wick (at least 2x the body size). This appears at the bottom of a downtrend. It tells us that sellers tried to push the price to new lows, but were met with a wall of demand.
2. The Shooting Star (Bearish Reversal): The mirror image of the hammer. It has a small body at the bottom and a long upper wick. This appears at the top of an uptrend, indicating the "FOMO" buyers were exhausted and the smart money has begun unloading.
3. The Engulfing Pattern (Momentum Takeover):
- Bullish Engulfing: A small red candle followed by a massive green candle that "swallows" the previous one.
- Bearish Engulfing: A small green candle followed by a massive red candle. This is a violent shift in sentiment. To be valid, these momentum takeovers MUST be supported by the "fuel" found in our [Volume Analysis Mastery] guide.
Phase 4: The Power of Indecision – Mastering the Doji
A Doji candle occurs when the open and close are almost identical, resulting in a "cross" shape. This represents a state of perfect equilibrium. While a Doji on its own isn't a signal, a Doji appearing after a long trend is a major red flag. It suggests the dominant trend is losing its grip. It is the market's way of saying "I don't know where to go next," which usually precedes a large move in the opposite direction.
Phase 5: The Marubozu – Total Dominance
A Marubozu is a candle with a large body and almost no wicks. It represents total control from open to close.
- Bullish Marubozu: Buyers were in control every second of the session.
- Bearish Marubozu: Sellers dominated from start to finish.
When you see a Marubozu breaking out of a consolidation zone, it is a high-conviction signal that the new trend has begun.
Phase 6: Advanced Strategy – The "Fakey" and Bull/Bear Traps
One of the most profitable setups occurs when a candle breaks out of a range, creates a long wick, and closes back inside the range. This "False Breakout" (also known as a Bull or Bear Trap) triggers the stop losses of retail traders. Professional traders wait for this "trap" to be set and then enter in the opposite direction.
Phase 7: The Inside Bar – The Coiled Spring
An Inside Bar occurs when a candle’s entire range (high to low) is contained within the range of the previous candle (the Mother Bar). This represents a period of consolidation and a "coiling" of energy. A breakout above or below the Mother Bar often leads to an explosive move. We use these setups for precision entries, as they allow for the tightest stops.
Phase 8: Common Mistakes and Risk Management
- Trading in a Vacuum: A hammer in the middle of a sideways range means nothing. Location is everything.
- Ignoring the Closing Price: You must wait for the candle to CLOSE. A candle can look like a beautiful hammer with 5 minutes left and turn into a bearish red bar by the bell.
- Standardized Risk: Because candlestick reversals can lead to volatile "snap-backs," we never execute without consulting [Position Sizing Mastery]. Your stop loss should always be placed just beyond the extreme of the wick (e.g., below the hammer’s wick), and your position size must be adjusted to keep your total risk at 1%.
Phase 9: Contextual Confluence
A single candle is a hint, but context is the conviction. At Smart Trades Zone, we look for "Confluence":
- Candle + Support/Resistance: A hammer at a major historical floor.
- Candle + Moving Average: A shooting star rejecting the 200-day EMA.
- Candle + Volume: A bullish engulfing pattern confirmed by a 2x increase in volume.
Summary: Become a Price Action Whisperer
Candlesticks are the closest thing to a "crystal ball" in trading because they reflect human emotion in real-time. By mastering the Big Three patterns and understanding the anatomy of rejection, you stop following the crowd and start leading your P&L. Look for the wicks, respect the bodies, and trade the confirmation. Your goal isn't to predict the future; it's to recognize the footprints of the smart money.