
Support and Resistance Trading: Master Key Price Levels
Learn how to identify critical support and resistance levels for high-probability trades. Master horizontal levels, trend lines, and dynamic zones to maximize your risk/reward ratio in any market.
Support & Resistance Playbook: Mapping the Zones of Interest (2026)
Introduction: The Floor and the Ceiling
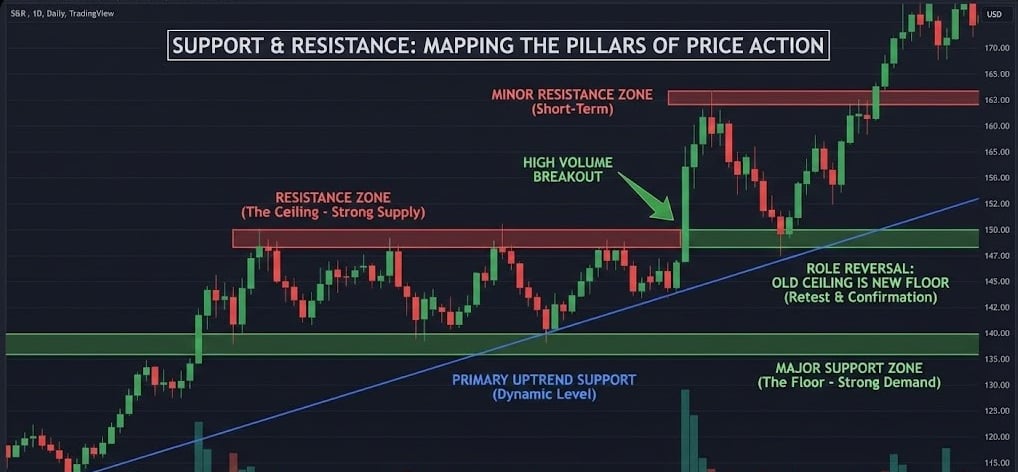
At Smart Trades Zone, we don't trade lines; we trade Zones of Interest. Support is the "Floor"—a price level where buying pressure (demand) is strong enough to halt or reverse a decline. Resistance is the "Ceiling"—a level where selling pressure (supply) overwhelms buyers, stopping a rally in its tracks. This playbook will teach you to stop guessing where a stock might stop and start seeing the invisible walls built by institutional capital.
If price action is the result of a continuous auction, then Support and Resistance are the boundaries where that auction reaches an equilibrium or a breaking point. Most amateur traders treat these as simple lines on a chart, often getting frustrated when the market "misses" their line by a few cents before reversing. To trade like a professional in 2026, you must understand that these are not exact numbers, but areas of high-density liquidity.
Phase 1: The Psychology of the Crowd
Support and Resistance aren't magic; they are fueled by human memory and regret. Every time the market returns to a major level, three groups of people are making decisions:
- The Happy Buyers: Traders who bought at a support level and saw the price rise. They now view that level as a "safe" entry and will want to buy more if the price returns, creating a self-fulfilling prophecy of demand.
- The Regretful Bench-Warmers: People who watched the price bounce off a level without entering. They feel the "pain of missing out" (FOMO). When the price returns to that level, they vow not to miss it again, creating a surge of new buying pressure.
- The Trapped Sellers: Shorts who sold at the support level, only to watch the price rip higher. They are now in a losing position. They pray for a return to their entry point so they can "exit at breakeven." To exit a short, they must BUY, adding even more fuel to the support bounce.
Phase 2: Identification—The Three Pillars of Confluence
We identify these zones using three primary methods. When all three align at the same price, we call it "Confluence"—the highest probability trade on the board.
1. Horizontal Levels: These are the most powerful. Look for obvious peaks and troughs on the Daily chart where price has historically reversed. The more times a level is "tested" and holds, the more significant it becomes.
2. Trendlines: These are "sloping" boundaries. By connecting higher lows in an uptrend or lower highs in a downtrend, we can predict where the next "dip" will be bought. A valid trendline needs at least three distinct touches to be confirmed.
3. Moving Averages: Institutions track the 50-day and 200-day EMAs religiously. These act as moving floors or ceilings that "chase" the price. In the [SPY Intraday Playbook], we often see these averages act as the primary bounce points during a sustained trend day.
Phase 3: The "Zones, Not Lines" Mandate
One of the biggest mistakes a trader can make is drawing a single, thin line at a specific price (e.g., $150.00). In a world of high-frequency algorithms and institutional "dark pools," markets are messy. Big players cannot fill their entire $500 million orders at a single penny; they need a range of prices to get their orders filled.
The Fix: Always draw a rectangular box that encompasses the wicks and bodies of recent candles. A zone of 0.5%–1% around a major price level accounts for this institutional "slippage." If you are trading the SPY at $700, your "zone" might be $699.50 to $700.50. This gives you a buffer against "head-fakes" and stop-hunts.
Phase 4: The Order Block Theory (Advanced)
To understand why zones exist, you must understand "Order Blocks." These are specific price ranges where institutions have left massive, unfilled "limit orders." When the market returns to these blocks, the remaining orders are triggered, causing a rapid rejection.
- Bullish Order Block: The last "down" candle before a massive move higher.
- Bearish Order Block: The last "up" candle before a massive move lower.
By identifying these blocks, you aren't just trading a line; you are trading where the "Big Money" has already shown their hand.
Phase 5: The Role Reversal Phenomenon
This is a core law of price action: Once a level is broken, its role flips. This is the market’s way of seeking "fair value."
- Resistance becomes Support: When price breaks above a ceiling, that level now becomes the new floor. Traders who missed the breakout will buy the first "retest" of that old resistance.
- Support becomes Resistance: If a stock crashes through a floor, that level becomes the new ceiling. This "Flip" is one of the most reliable entry signals because it shows a fundamental shift in market sentiment.
Phase 6: Trading Strategies—Bounces, Breakouts, and Retests
- The Bounce Play: You wait for price to enter a support zone. You don't just blindly buy; you wait for a confirmation candle (like a Pin Bar or Bullish Engulfing) that shows buyers have officially taken control of the zone.
- The Breakout Play: You wait for a decisive close beyond a zone.
- The Key Confirmation: A valid breakout MUST be accompanied by the conviction shown in our [Volume Analysis Mastery] guide. If it breaks out on low volume, it is likely a "Fake-out" (Bull Trap) designed to liquidate retail traders and trap them on the wrong side of the trade.
- The "Retest" Entry: This is the professional's favorite entry. Instead of chasing a breakout, you wait for the price to come back and test the "broken" level. If it holds, you enter with a much tighter stop and a higher reward-to-risk ratio.
Phase 7: Multiple Timeframe Analysis (The Brick Wall vs. The Speed Bump)
A support level on a 5-minute chart is a speed bump; a support level on a Daily or Weekly chart is a brick wall.
- Top-Down Approach: Always start your analysis on the Daily or Weekly timeframe to find the "Major" zones. These are the levels where the "Big Money" is playing.
- Execution: Once you know where the major floor is, zoom into the 15-minute or 5-minute chart to find "Minor" levels for precision entry. Trading a 5-minute bounce into a Daily resistance level is a recipe for disaster.
Phase 8: Risk Management—The 1% Rule
Support and resistance provide natural, logical spots for stop losses.
- Stop Placement: Never place your stop exactly on the line. Algorithms are programmed to "hunt" those stops. Give the trade room to breathe by placing the stop just outside the zone—below the support box for longs or above the resistance box for shorts.
- Risk/Reward: We only take trades where the distance to the next major zone (Target) is at least 3x the distance to our stop loss.
Summary: Reading the Map
Technical analysis is the art of identifying where the "Smart Money" is likely to defend a position. Mastering these zones is the first step toward [overcoming fear and greed], as it allows you to trade a pre-defined plan based on institutional footprints rather than reacting emotionally to every tick of the tape. By mastering the zones, you stop chasing price and start waiting for price to come to you. Don't fight the walls—trade the bounces and ride the breaks.