
Risk Reward Trading Strategy: Master the Risk to Reward Ratio
Learn how to calculate and implement a low risk high reward trading strategy. Master the math behind the 1:3 risk to reward ratio in trading to protect your capital.
In the active market arena, amateur traders spend a disproportionate amount of time looking for a flawless technical indicator or a predictive chart pattern that guarantees a high win rate. However, institutional asset managers and seasoned market specialists understand that accuracy is completely secondary to mathematical asymmetry. To truly master what is risk reward in trading, a market participant must realize that sustainable profitability is not determined by how often you are right, but rather by how much capital you capture when you are correct versus how much you forfeit when you are wrong. The risk to reward ratio in trading serves as the cold, unbiased framework that converts unpredictable price action into a highly structured, repeatable business model.
At its core, the risk-reward ratio is a direct comparison of the maximum capital exposed to potential loss against the projected capital target earmarked for potential profit on a single position. It maps out an explicit, legally binding contract between your portfolio and the market before a single dollar is ever committed to live tape. This relationship is expressed mathematically as $1:X$, where $1$ represents your baseline unit of risk and $X$ represents the corresponding multiple of expected reward. To establish this framework accurately on a modern trading platform, you must construct every single execution setup around three non-negotiable architectural price points:
The Entry Price: The exact technical execution level where your buy or sell order fills and your position becomes live in the market.
The Stop-Loss Price: The predefined technical invalidation line where your brokerage platform automatically liquidates the position, serving as a hard ceiling that prevents a minor pullback from turning into an account-killing drawdown.
The Take-Profit Target: The objective structural zone on the chart—typically derived from prominent overhead resistance, historical key distribution nodes, or liquidity pools—where you will systematically scale out or close your trade to lock in realized gains.
The ultimate power of integrating a mechanical risk-reward strategy is its ability to completely decouple your portfolio's performance from the toxic psychological urge to be correct on every single execution. When your average winning trade is structurally engineered to be significantly larger than your average losing trade, you can lose more than half of your total positions and still see your equity curve consistently grind upward. By calculating the mathematical relationship between your win rate and your ratio, you construct a financial shield that completely insulates your account from normal losing streaks. This objective framework acts as a powerful behavioral filter, stripping human emotion entirely out of live market hours and allowing you to easily pass on low-quality setups where the potential profit margin fails to justify the structural risk required to take the position.
The Foundations of Risk to Reward Ratio in Trading
Transitioning from a theoretical appreciation of risk boundaries into the active extraction of market profits requires a specialized operational lens. While many market participants grasp the abstract concept of risk management, they consistently fail in execution because they look for trades backwards. They locate an asset they find attractive, enter the position blindly, and then attempt to retroactively paste a stop-loss and a profit target onto their chart. To run a highly profitable trading hub, this workflow must be completely inverted. Designing a genuine low risk high reward trading strategy relies entirely on identifying environments where the market’s structural architecture allows you to risk a remarkably small amount of capital to capture a disproportionately massive payout. This mathematical imbalance is known as trading asymmetry.
The true definition of a low-risk setup is frequently misunderstood by the retail trading community. Amateurs incorrectly assume that a low-risk trade means an asset has a zero percent chance of falling or that the setup is a guaranteed winner. In the live markets, no such certainty exists. A professional market specialist defines low risk purely by the proximity of their entry price to their technical invalidation point. An ideal asymmetric setup occurs when you can execute an entry immediately adjacent to a major structural boundary—such as a macro supply-and-demand zone, a historical support line, or a high-volume node on the volume profile. By entering the trade precisely at this inflection line, your mandatory stop-loss can be nestled tightly just on the other side of the boundary. If the boundary fails, you exit immediately for a minor, negligible loss. If the boundary holds, you catch the exact turning point of a massive directional swing, maximizing your financial upside while keeping your actual capital exposure tightly compressed.
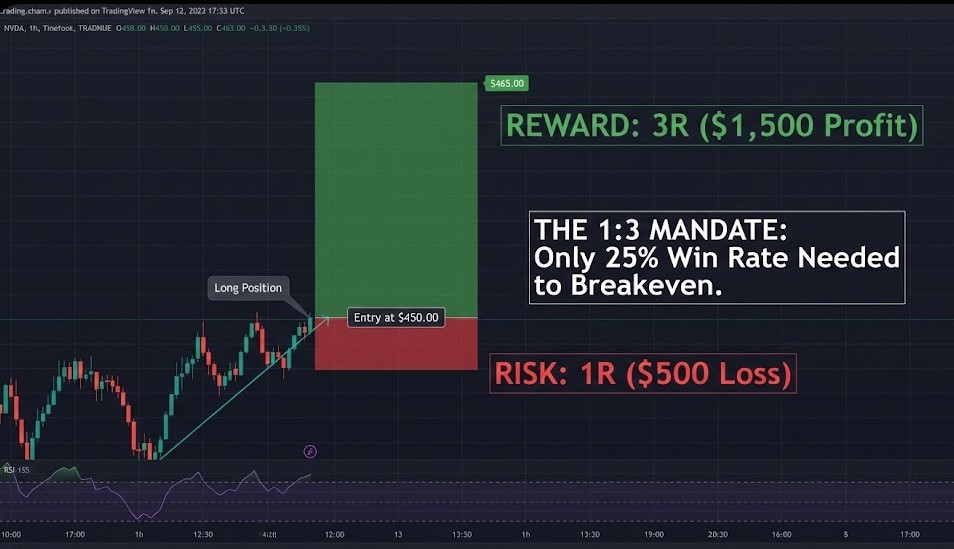
The Mechanics of the 1:3 Risk Reward Trading Strategy:
To systemize this approach, successful options and equities traders frequently build their entire playbook around a strict 1:3 risk reward trading strategy. Operating under a rigid 1:3 framework means that for every single dollar you commit to a technical invalidation space, you must have an objective, unblocked chart runway to capture at least three dollars of price appreciation before encountering major overhead resistance. This specific ratio transforms the foundational math of your equity curve, shifting the burden of profitability away from high-stress prediction and placing it squarely onto statistical probability.
To execute this specific asymmetric framework seamlessly on your platform, you should follow a strict three-step technical verification blueprint before routing any order:
Isolate the Macro Runway: Scan higher-timeframe charts to ensure there are no prominent congestion zones, heavy moving averages, or historical liquidity pools blocking the path between your entry level and your 3R target. If the chart features dense overhead resistance close to your entry, the trade cannot satisfy a clean 1:3 profile and must be automatically disqualified.
Locate the Invalidation Node: Identify the exact price point where the chart structure proves your thesis is officially dead. This node should sit directly below key structural defense levels, providing your position with maximum technical protection while minimizing the physical distance to your entry order.
Execute via Limit Orders: Refuse to chase fast-moving price action using emotional market orders. Instead, place passive limit orders directly at the optimal technical entry line, forcing the market to come to your price. This disciplined execution keeps your risk distance exceptionally tight and preserves the integrity of your 1:3 mathematical layout.
The mathematical elegance of maintaining a continuous 1:3 risk-reward strategy is revealed when analyzing its impact on your portfolio's breakeven thresholds. When your winning trades consistently pay out three times the size of your standard losses, your required win rate drops precipitously to a mere 25%. If you execute one hundred trades over a quarter, lose seventy-five of them for a standard one-hundred-dollar loss, and win just twenty-five for a three-hundred-dollar gain, your net account balance remains completely flat. Consequently, if your technical execution skills allow you to achieve a modest forty percent or fifty percent win rate, a 1:3 structural edge automatically forces your equity curve into an aggressive, compounding upward trajectory.
📈 Operational Rule for the Trading Hub:
Never compromise your ratio mid-trade by scaling out of winners prematurely. When an asymmetric position begins moving in your favor, the human brain experiences an intense psychological urge to lock in green numbers immediately to secure a emotional win. Doing this destroys your long-term math. You must allow your winners the spatial freedom to hit their full 3R targets, ensuring they retain the raw financial power required to comfortably erase your standard, operational losses.
Ultimately, mastering an asymmetric trading strategy requires completely abandoning the amateur desire to control where the market goes. A professional accepts that price movement is fundamentally random and unpredictable in the short term. Instead of trying to predict the future, the strategist focuses entirely on controlling the variables they actually own: their exact entry location, their maximum structural risk per trade, and the minimum profit multiple they require to expose their capital to the tape. By treating your trading platform as an objective matching engine that pairs minimal risk with expansive reward corridors, you transform speculation into a cold, mechanical process of compounding capital extraction.