
How to Trade $SPY Weekly Options: 0DTE Playbook & Levels
Master your SPY weekly options trading with our 0DTE strategy playbook. Get exact price levels, daily theta decay analysis, and strict risk management rules.
OPTIONS TRADING
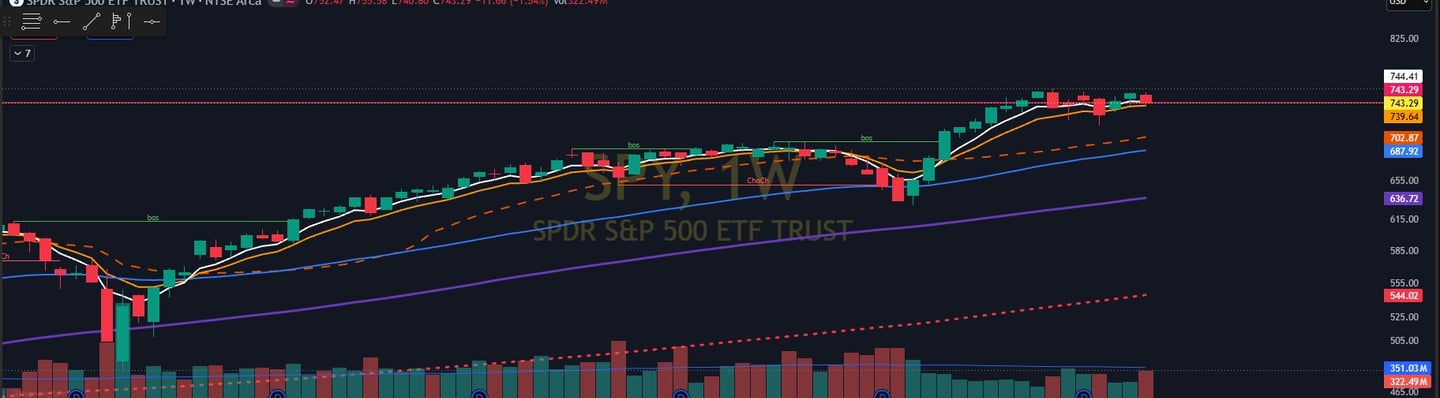
Table of Contents:
Weekly SPY Options Trading Playbook: Macro Catalysts & Core Levels
SPY Technical Layout: The Core Metrics & Levels:
SPY closed out the last session at $743.29, landing in the upper half of the day's range after a modestly positive session. With the market highly sensitive to growth signals and tech earnings hitting peak volume, this week is shaping up to be a stock-picker's paradise.
Before the opening bell rings on Monday at 9:30 AM ET, here is where the broad market stands structurally:
Friday’s Price Action: Opened at $742.08, carved out a high of $747.29, hit a low of $740.80, and closed at $743.29 on 62.65M volume.
Volume Weighted Average Price (VWAP): The monthly volume-weighted average price sits just above us at $744.65.
Key Upside Resistance: If buyers step in, look for near-term overhead supply at $747.29, followed by $749.53, and structural resistance at $752.41.
Key Downside Support: If the tape weakens, immediate support rests at $740.80 (Friday's low), followed by $739.51, with a much deeper structural pocket down at $731.53.
Economic Calendar: Flash PMIs and Labor Markets:
We are staring down a relatively light macroeconomic calendar for July 20–24, 2026. Because Fed headlines will likely take a back seat, the tape will be hypersensitive to growth surprises from these key data releases:
Monday, July 20 (10:00 AM ET): CB Leading Index for June drops. This is a crucial gauge of the economy's broader trajectory, with the previous reading sitting around 116.9%. The Kansas Fed Manufacturing Index will also provide a regional manufacturing readout.
Tuesday, July 21 (Data drops intraday): S&P Global Flash Manufacturing PMI and S&P Global Flash Services PMI. This will give us our very first look at factory and services activity for the month of July.
Thursday, July 23 (8:30 AM ET): Initial Jobless Claims hit the wires. The labor market remains under a microscope; the last report showed claims falling to their lowest levels since mid-May.
Thursday, July 23 (10:00 AM ET): New Home Sales for June will cross the tape to show the pulse of the housing market, following a -7.3% Month-over-Month decline in the prior print.
Q2 Earnings Peak: Big Tech Volume Heavyweights:
This is the heaviest earnings week of the entire Q2 2026 season. Nearly 500 companies are reporting, including roughly 86 S&P 500 constituents, representing about 20% of the index's total market cap. Wall Street is currently forecasting S&P 500 Q2 EPS growth of ~23.6% Year-over-Year, which would mark the second consecutive quarter of 20%+ growth.
Here are the heavyweights that will move the SPY index fund this week:
Tesla (TSLA) — Tuesday, July 21 (After Market Close): Revenue estimates stand at $27.58B (+23% YoY) with an EPS estimate of $0.88. The stock slipped 3% on Friday ahead of the print. The main narrative here will center on profit margins and custom AI/semi chip progress.
Alphabet (GOOGL) — Tuesday, July 21 (After Market Close): BMO recently raised its price target to $455 from $435. After blowing past Q1 estimates by a massive 93%, the street will be hyper-focused on Google's cloud growth and tangible AI monetization.
Intel (INTC) — Thursday, July 23 (After Market Close): Revenue estimates are sitting at ~$14.3B, EPS at ~$0.20, and gross margins at ~39%. Intel's stock got hammered -9% on Friday amid a broader semiconductor rout. This report is a massive test for the entire AI trade, putting Intel's turnaround narrative under heavy pressure.
Charter Communications (CHTR) — Friday, July 24: The company goes under the microscope as it navigates ongoing customer losses and mounting satellite competition from Starlink.
Domino's Pizza (DPZ): Expected to post an EPS of ~$4.17 as a notable consumer spending health indicator.
Tactical Execution: How to Trade the Tape This Week:
With a quiet macro backdrop, company-specific news will dominate daily price action. Tuesday after the close is the true "one-two punch" of the week, where Tesla and Alphabet will single-handedly set the tone for broad market volatility.
Keep your execution rules simple and trade around the primary "line in the sand" at $740.80:
The Bull Case: As long as SPY holds firmly above $740.80, the weekly structure stays constructive. Look to play intraday momentum toward $747.29.
The Caution Zone: If we lose $740.80, start treating the immediate tape as weaker. Scale back long exposure and watch for a quick test of $739.51.
The Bear Case: Breaking below $739.51 marks a clean structural breakdown. If a poor earnings reaction from Big Tech or Intel triggers this flush, it opens up the trapdoor for a deeper slide down toward $731.53.
SPY 0DTE & Weekly Options Execution Plan (Week of July 20–24, 2026)
Anchored to Friday 7/17 Close: $743.29
Line in the Sand: $740.80 (Friday Previous Day Low)
Key Levels — Trade the Range - Crucial Price Levels to Watch:
Major Resistance ($752.41): Weekly ceiling with 13 historical touches, indicating strong supply.
Minor Resistance ($749.53): Heavily tested area with 15 touches, standing as the largest resistance wall above current price action.
Previous Day High / PDH ($747.29): Friday's high and your first line of intraday overhead resistance.
Current Reference Price ($743.29): Friday close and key weekend pivot.
Previous Day Close / PDC ($743.29): Matches the weekend close, ensuring no overnight gap reference conflicts.
Line in the Sand ($740.80): Friday’s low. If the market loses this level, structural integrity weakens immediately.
Major Support ($739.51): The first meaningful daily support pocket sitting directly below the Friday low.
Deeper Support ($731.53): A major 6-touch swing low that serves as the ultimate structural floor for the week.
Range Logic Scenarios:
Bullish Range: If price holds above $740.80 and pushes toward $747.29, look to buy calls on intraday dips into the $741–$742 zone, targeting $747–$749.
Neutral Range: If price action becomes choppy between $740.80 and $747.29, focus on selling premium or executing out-of-the-money (OTM) iron condors on 0DTE contracts.
Bearish Breakdown: If price loses $740.80 on high volume, look to buy puts targeting $739.51 first, followed by $731.53 if downside momentum persists.
Theta Environment by Day:
This week's premium decay environment is highly dependent on the corporate earnings calendar. Major tech earnings on Tuesday afternoon and Thursday afternoon will cause implied volatility (IV) to pulse dynamically through the week.
Daily Implied Volatility & Theta Breakdown:
Monday, July 20: Moderate premium decay with a slightly elevated IV tone due to pre-earnings positioning. 0DTE premiums are fuller, making them lucrative for premium sellers or cheaper for strategic buyers. Morning momentum trades are highly favored.
Tuesday, July 21: Premium decay accelerates into the closing bell with an elevated IV tone acting as an earnings catalyst. Expect normal decay during the morning session, followed by an afternoon IV lift. Avoid holding SPY 0DTE options into the close to protect against erratic pricing.
Wednesday, July 22: High potential for an IV crush as volatility collapses if big tech earnings deliver inline. This stands as the single best theta-selling day of the week. If the market gaps at the open, wait 30 minutes for IV to settle before writing premium.
Thursday, July 23: Moderate premium decay with a rebuilding, slightly elevated IV tone driven by upcoming earnings and morning jobless claims. Claims data drops at 8:30 AM ET and can sharply move SPY pre-market. Normal decay resumes post-claims, favoring afternoon 0DTE trades.
Friday, July 24: Maximum premium acceleration takes over as weekend theta pricing dominates the board. This is a classic Friday 0DTE environment where afternoon decay provides an immense edge if price remains range-bound. This is the optimal day for OTM credit spreads.
Strategic Key Takeaways:
Best days to BUY directional 0DTE: Monday morning and Tuesday morning before earnings-induced implied volatility spikes get too extreme.
Best days to SELL premium and harvest theta: Wednesday due to the post-earnings volatility crush, and Friday afternoon.
Highest-risk day for holding options: Tuesday due to massive overnight macroeconomic catalyst risks.
0DTE Execution Playbook - Contract Selection Guide:
High-Conviction Directional Setups: Utilize In-The-Money (ITM) Calls or Puts by selecting strikes 1 to 2 positions inside the current price. Target a Delta of 0.55 to 0.65. A higher delta ensures your contract tracks SPY price movements tightly with minimal theta bleeding. You pay a higher premium up front for cleaner P&L correlation.
Moderate-Conviction Directional Setups: Utilize At-The-Money (ATM) strikes. Target a Delta of 0.45 to 0.55. This strikes a clean balance between delta sensitivity and theta decay. Use this when you anticipate a directional move but lack certainty regarding its total magnitude.
Lottery and Convexity Plays: Utilize Out-Of-The-Money (OTM) contracts by selecting strikes 1 to 2 spots outside current price limits. Target a Delta of 0.20 to 0.35. This yields low up-front costs and high gamma explosive potential if a sharp move hits, but you must accept that the majority of these positions expire worthless. Keep sizing small.
Theta Harvesting Strategies: Utilize OTM Credit Spreads by selling options 2 to 3 strikes out-of-the-money. Target a short Delta of 0.20 to 0.30. This strategy collects premium that rapidly decays to zero by the closing bell. Risk remains defined and strictly capped as long as the underlying price holds within your expected trading range.
When to Deploy Each Strategy:
Deploy ITM Contracts When: You hold a definitive directional bias, a clear structural level is being tested, it's the morning session, and you expect a rapid 1 to 3 point move on SPY.
Deploy ATM Contracts When: You anticipate immediate market movement but remain uncertain about overall trend strength, or when trading around highly specific intraday economic data prints.
Deploy OTM Contracts When: You are selling vertical premium in a range-bound, low-velocity market environment, or when taking low-cost, calculated breakout shots late in the week.
Intraday Trading Session Breakdown:
Morning Session (9:30 AM – 11:30 AM ET):
9:30 AM – 9:45 AM ET: Observe price action and do not entry any trades in the first 15 minutes unless an absolute major level is being actively tested. Opening volatility is largely noise; allow the daily range to establish itself first.
9:45 AM – 10:15 AM ET: This is your primary morning entry window. If price cleanly rejects the $747.29 previous day high, look for put opportunities. If price cleanly bounces off the $740.80–$741 support floor, look for call opportunities.
10:15 AM – 11:30 AM ET: This is your core trend window. Look for strong continuation setups or key structural reversals relative to the intraday Volume Weighted Average Price (VWAP). Stick strictly to ITM or ATM contracts here since afternoon theta decay hasn't accelerated yet.
Midday Session (11:30 AM – 1:00 PM ET):
11:30 AM – 1:00 PM ET: Actively reduce exposure or flatten open positions. If a morning 0DTE position has reached its target, take your profit. If a trade is stalling, scale out. Avoid hoping for a reversal during the lunchtime liquidity drain when spreads widen and time decay begins to bite.
Afternoon Session (1:00 PM – 4:00 PM ET):
1:00 PM – 2:30 PM ET: This opens the secondary entry window for fresh positions. This is where premium-selling mechanics shine on range-bound days. If SPY remains pinned tightly between $743 and $746, look to deploy structured OTM credit spreads.
2:30 PM – 3:30 PM ET: Welcome to the peak theta harvest zone. If you sold short premium earlier and price has not breached your strike thresholds, let time decay run its course. If you are holding directional long 0DTE contracts, this is your absolute final window to exit with intact premium value.
3:30 PM – 4:00 PM ET: Manually close out all remaining 0DTE positions. Gamma spikes massively in the final 30 minutes of the day, making pin risk incredibly dangerous. Never leave your account vulnerable to late-day algorithmic flushes.
Weekly Options Approach (1–5 DTE):
Weekly contracts provide traders with multi-day runways and significantly less immediate time decay pressure than 0DTE instruments. Deploy these vehicles when you maintain a broader, macro thesis but want to completely bypass overnight equity gap risk.
Deciding Between Weeklies and 0DTE:
Choose Weekly Options When: You expect a structural market move to unfold over a multi-day timeline rather than a single session, when you want to navigate mid-week catalysts without instant decay, or when you require wider strike spreads.
Choose 0DTE Options When: You are capitalizing on an immediate intraday trend, the setup is materializing live at a key level during the active session, and you want zero overnight capital exposure.
Weekly Strategic Playbook:
Bullish Weekly Setup: If SPY holds structurally above $740.80, buy the $743 Strike Call with a Wednesday or Friday expiration. Trigger this on a verified bounce off the $740.80–$741 zone with active VWAP support. Target a move back toward $747 and $749. An intraday close below $739.51 completely invalidates this thesis.
Bearish Weekly Setup: If SPY cleanly loses $740.80, buy the $742 Strike Put with a Wednesday or Friday expiration. Trigger this on a high-volume break below $740.80. Target an extended downside move toward $739.51 and $731.53. A recovery back above $742 invalidates this thesis.
Earnings Volatility Straddle Strategy: Deploy a balanced straddle or strangle using Tuesday or Wednesday expiries. Enter during the Monday or Tuesday morning session before premium values balloon from pre-earnings demand. Target an explosive post-earnings gap in either direction, keeping sizing small to protect against severe post-announcement volatility crush.
Risk Management Rules:
Sizing Parameters (Based on a Benchmark $25K Account):
0DTE Directional Trades (ITM/ATM): Limit max capital allocation to $500–$750 per trade. Cap position size at 2 to 3 contracts. Implement a strict maximum loss limit of $150–$225 per trade based on a defined 15% risk stop.
0DTE OTM Lottery Trades: Limit max allocation to a fixed $200 ceiling. Cap size at 1 to 2 contracts. Treat this capital as a full-loss risk from entry.
0DTE OTM Credit Spreads: Maintain a strict $300 maximum margin allocation per trade. Cap size at 1 to 2 vertical spreads, with total risk clearly defined by the width of the chosen strikes.
Weekly Directional Trades: Limit max capital allocation to $750–$1,000 per setup. Cap position size at 2 to 3 contracts. Implement a hard maximum loss limit of $225 based on a trailing 15% risk stop.
Inflexible Operational Trading Rules:
Rule 1: Maintain a maximum of 2 open 0DTE positions at any single time. Never, under any circumstances, average down on a losing 0DTE options position.
Rule 2: Enforce a hard 15% stop loss from your exact entry price on all directional long options. If a contract is purchased at $1.00, an automatic sell order must trigger if it hits $0.85. No exceptions, no adjustments.
Rule 3: Do not hold active long 0DTE contracts into the final 30 minutes of the trading day unless the trade is firmly in profit and protected by a locked-in trailing stop.
Rule 4: Enforce a hard daily max loss limit of $500. If your realized losses hit this threshold, your terminal is done for the day. Close the charts and walk away.
Rule 5: Enforce a hard weekly max loss limit of $1,000. If your account hits this cumulative loss by Wednesday, you are barred from executing fresh trades for the remainder of the week.
Rule 6: Proactively scale down total position sizing on Tuesdays and Thursdays. Earnings volatility and key economic data releases naturally widen bid-ask spreads, which dramatically increases slippage costs.
Daily Game Plan Summary:
Monday, July 20: Monitor market reactions to the $740.80 and $747.29 levels at the opening bell. Focus primarily on morning directional 0DTE execution if a clean retest occurs. Monitor the Leading Index release at 10:00 AM ET.
Tuesday, July 21: Focus on pre-earnings market positioning and watch for late-afternoon premium expansion. Take directional morning 0DTE opportunities, but ensure you do not hold any SPY contracts into the closing bell ahead of major tech earnings.
Wednesday, July 22: Trade the post-earnings digestion. Watch for a systemic drop in premium prices. Prioritize premium selling and credit spreads to harvest rapid time decay on range-bound 0DTE setups.
Thursday, July 23: Wait at least 30 minutes for the initial opening volatility to settle following the 8:30 AM ET jobless claims print. Transition to an afternoon premium harvesting strategy as intraday trading structures normalize.
Friday, July 24: Capitalize on aggressive weekend time decay. Look to deploy out-of-the-money vertical credit spreads against well-defined intraday ranges during the afternoon session.
Pre-Trade Checklist:
Run through these operational checkpoints before entering any trade:
Identify exactly where SPY is trading relative to the $740.80 main trend line.
Locate where SPY is trading relative to its daily Volume Weighted Average Price (VWAP).
Check the clock to ensure you are not entering a position during the chaotic first 15 minutes of the open.
Clearly define your exact technical entry trigger, target profit milestone, and hard stop-loss level.
Verify that your total position size complies with your daily risk limits.
Confirm that you do not have more than 2 active 0DTE positions running simultaneously.
Check the daily schedule for corporate earnings announcements or economic data prints that could trigger unexpected volatility.
Ensure you are purchasing ITM/ATM contracts for directional trades, or selling OTM contracts for theta accumulation.
Set a clear target exit time, ensuring all intraday positions are closed well before 3:30 PM ET.
Market Comparison Matrix: SPY vs. SPX vs. QQQ vs. /MES Futures
Core Trading Environment Profiles:
SPY (S&P 500 ETF): Maps directly to the S&P 500 index. It closed the last session at $743.29, within an intraday range of $740.80 to $747.29. Each option controls 100 shares of the underlying ETF. It boasts deep institutional liquidity with the tightest bid-ask spreads of any equity asset class, settles physically in shares, and is subject to standard short-term capital gains tax. Regular hours run 9:30 AM to 4:00 PM ET, with pre-market liquidity scaling from 4:00 AM ET. Minimum recommended execution capital stands at ~$500–$1,000 per 0DTE trade.
SPX (S&P 500 Index): Tracks the broad S&P 500 cash index directly. It closed the last session near a cash value of $7,432.90, trading within an approximate range of $7,408 to $7,473. Each option contract represents $100 multiplied by the index value. It exhibits deep liquidity, though it carries slightly wider bid-ask spreads than SPY. It settles strictly in cash, qualifies for favorable Section 1256 tax treatment (a fixed 60% long-term and 40% short-term split), and trades during regular market hours from 9:30 AM to 4:00 PM ET. Minimum capital requirements sit significantly higher at ~$3,000–$5,000 per contract.
QQQ (Nasdaq-100 ETF): Tracks the tech-heavy Nasdaq-100 index. It closed the last session at $695.33, navigating a volatile daily range of $686.76 to $702.30. Contract size covers 100 underlying shares. It features exceptionally deep liquidity, especially during heavy corporate earnings weeks. It features physical share settlement, incurs short-term capital gains tax, and mirrors SPY’s hours from 9:30 AM to 4:00 PM ET (including the 4:00 AM ET pre-market window). It requires a baseline capital deployment of ~$500–$1,000 per 0DTE trade.
/MES (Micro S&P 500 Futures): Represents the micro-sized S&P 500 futures contract at one-tenth the scale of standard E-mini futures. It closed near $7,432.90, mechanically mirroring SPX price fluctuations. Contract sizing pays out at a linear $5 per index point. It commands massive liquidity with continuous 23/5 market access running from Sunday at 6:00 PM ET through Friday at 5:00 PM ET. It settles strictly in cash, enjoys identical Section 1256 tax advantages, and requires a dynamic maintenance margin of roughly ~$1,200 per active contract.
Performance Metrics and Friday Range Alignment:
SPY Range Position: Closed at $743.29 relative to a $740.80 intraday low and a $747.29 high. Daily VWAP printed at $744.65, anchoring the weekend close firmly within the upper half (57%) of its daily range.
QQQ Range Position: Closed at $695.33 relative to a $686.76 low and a $702.30 high. Daily VWAP printed at $696.20, matching SPY by positioning its weekend close in the exact upper half (57%) of its intraday range.
Volatility Divergence Signal: QQQ carved out a massive $15.54 absolute daily range compared to SPY’s constrained $6.49 layout. On a percentage basis, QQQ moved 2.4 times more aggressively than SPY. This significant volatility expansion serves as a definitive signal for where institutional capital is moving.
When to Pivot to $QQQ Options:
Tech earnings act as the primary market catalyst this week, making QQQ your baseline deployment vehicle. With heavy weights reporting after Tuesday's close, the index is poised for massive relative movement. QQQ's daily technical layout displays overhead resistance levels at $722.03 (8 touches) and $726.39 (7 touches), leaving considerable structural upside runway above the current close if earnings surprise to the upside. Key downside support parameters rest at $695.25 and $686.76.
If SPY becomes pinned within a tight sideways range while QQQ actively tests its daily highs, trading SPY options leaves money on the table. QQQ options will command superior intraday gamma and sharper premium expansion per dollar of risk due to the amplified velocity of the underlying asset.
Primary QQQ Deployment Triggers: Marquee technology earnings releases, broad-market SPY consolidation occurring alongside clear Nasdaq trend divergence, situations requiring higher delta sensitivity per dollar spent, or highly sector-specific technical trend setups.
When to Pivot to $SPX Index Options:
The overarching advantage of deploying SPX lies in its Section 1256 tax classification. Regardless of whether a position is held for three minutes or three hours, all realized capital gains are taxed at a blend of 60% long-term and 40% short-term rates. On a standard $500 intra-week profit, this structural tax shelter translates to an immediate savings of $50–$70 compared to SPY's ordinary short-term tax brackets. Keep in mind that SPX carries 10 times the notional value of SPY, meaning premiums require higher capital allocations and present wider bid-ask spreads.
Primary SPX Deployment Triggers: Executing intraday directional holds lasting multiple hours where tax drag compromises performance, writing vertical credit spreads or iron condors to exploit index margin efficiencies, scaling up total position sizes, or operating in environments where chasing razor-thin bid-ask spreads is a secondary concern.
When to Pivot to /MES Micro Futures:
When expanding implied volatility overinflates premium pricing, long options strategies face a severe systemic headwind. Micro futures resolve this by providing pure, linear price exposure completely free of an option's implied volatility tax. Tracking the S&P 500 index at $5 per point, a 5-point move in SPY translates directly to a $250 return per contract. There is no theta decay to fight, no vega fluctuations to time, and zero risk of a post-earnings volatility crush.
The primary trade-off is the absolute lack of option-style asymmetric gamma acceleration. While a well-timed 0DTE option contract can rapidly triple in value on an abrupt 2-point market spike, an /MES contract yields a fixed, mathematically capped return, trading explosive convexity for clean, predictable execution.
Primary /MES Deployment Triggers: Elevated market volatility driving options premiums to expensive, unsustainable extremes ahead of major releases, wanting overnight or pre-market position exposure without paying the compounding time decay of weekly options, utilizing 23/5 liquidity to trade macroeconomic prints outside regular exchange hours, or executing clear directional biases immediately after earnings drop when options face an intense volatility crush.
Daily Asset Selection Cheat Sheet:
Monday: Focus on SPY or QQQ 0DTE contracts. Volatility levels remain normalized with clean structural lines to trade off of. Favor QQQ if the tape shows tech leading pre-earnings positioning.
Tuesday: Prioritize QQQ options or /MES futures. Utilize QQQ to position directly for late-day big tech earnings exposure. Pivot to /MES if you prefer to bypass inflated pre-earnings options premiums.
Wednesday: Target SPY 0DTE premium selling or directional /MES positioning. The anticipated post-earnings volatility collapse creates a prime environment for short SPY credit spreads. Use /MES if you have a definitive directional trend read.
Thursday: Focus on QQQ options or /MES futures. The late-day semiconductor earnings act as a primary catalyst that moves QQQ much more aggressively than SPY. Deploy /MES if morning labor data spikes overnight volatility.
Friday: Lean heavily into SPY 0DTE credit spreads. The rapid, late-day weekend theta acceleration on broad-market SPY levels provides the cleanest, most statistically sound premium-harvesting edge of the entire week.
The Bottom Line Strategy:
SPY remains your operational vehicle for methodical theta-harvesting and range-bound sessions.
QQQ serves as your precision tactical weapon when technology earnings dominate volatility metrics.
SPX provides institutional-level tax mitigation for larger position scaling and extended intraday holding periods.
/MES acts as your directional escape hatch whenever elevated options pricing imposes an unnecessary premium tax on your execution.
Retail Sentiment & The Reddit Pulse: Decoding the Herd
Current Sentiment Pulse Read:
Fear & Greed Index: Slipped down to 37 (dropping from 49 last week), signaling a distinct psychological shift out of Neutral and firmly into Fear territory.
Equity Put/Call Ratio: Hovering between 0.58 and 0.69, which confirms that retail traders remain heavily call-heavy and retain a stubborn structural upside bias.
Index Put/Call Ratio: Sits at an elevated 1.26, showing that institutional smart money is aggressively purchasing downside protection.
Options Volume (10-Day Moving Average): Averaging a massive 5.5 million contracts, proving that overall retail risk appetite remains at historically high levels.
Broad Retail Sentiment: Reflects a neutral, fence-sitting posture where small traders are displaying a mix of caution and indecision without entering full capitulation.
Retail Options Activity: Remains record-breaking through the first half of 2026, reinforcing that retail options volume continues to act as a dominant liquidity force on the tape.
The Volatility Gap: Retail Optimism vs. Institutional Hedging:
Retail traders are still actively buying calls, but their overall conviction is beginning to fade following the recent semiconductor rout. While the equity put/call ratio proves the herd is still betting heavily on an upside market expansion, small traders are finding themselves fighting a weakening tape. The crowd isn’t running for the exits just yet, but the early stages of a position unwind are becoming visible.
Meanwhile, institutional players are executing the exact opposite game plan. With the index put/call ratio climbing to 1.26, large operators are aggressively buying downside insurance. This stark divergence—retail buying upside calls while institutions load up on protective puts—is a classic structural gap that historically precedes sharp volatility spikes and sudden market flushes.
Four Critical Retail Pitfalls to Avoid This Week:
Chasing Post-Earnings Momentum: Trading forums will light up on Tuesday night after major mega-cap tech earnings cross the tape. The natural retail impulse is to buy morning calls on Wednesday in the direction of the headline move. This is a classic volatility crush trap where option premiums instantly collapse post-announcement, allowing severe time and volatility decay to wipe out your position even if you guess the market direction perfectly.
Doubling Down to Revenge Trade: The recent semiconductor sell-off severely shook retail traders who were positioned heavily long tech. The temptation this week will be to "make it back" by loading up on tech calls to catch a speculative bounce. This is precisely where enforcing strict daily loss limits saves accounts from catastrophic drawdown. Never skip a stop because of a tilted emotional state.
Following "Diamond Hands" Hype into 0DTE: The zero-days-to-expiration trading community has exploded, continuously celebrating massive percentage winners while silently burying the vast majority of positions that expire completely worthless. This extreme survivorship bias makes 0DTE look deceptively easy. Always size every short-duration position under the explicit assumption that the premium can go to zero.
Ignoring Smart Money Positioning: When institutional hedging spikes to a 1.26 ratio while retail sits at a call-heavy 0.58, it is a flashing warning sign. Institutional operators are explicitly telling you they expect heavy volatility ahead. Respect their capital positioning by tightening your defensive stops, shrinking your baseline position sizes, and refusing to treat this week like a normal low-volatility grind.
Maximizing Your Contrarian Trading Edge:
Retail sentiment routinely runs completely opposite to high-frequency trading order flow, often serving as a reliable leading indicator for abrupt market reversals. When the retail crowd reaches peak consensus and confidence, the risk of a sharp market pivot peaks. Right now, the herd finds itself in a cautious, fence-sitting middle zone, meaning the tape does not offer a clean, extreme contrarian signal in either direction yet.
To pinpoint a high-probability reversal this week, watch for three specific sentiment triggers:
A drop in the broader Fear & Greed index below 25, signaling absolute herd capitulation and a highly reliable contrarian buying opportunity.
An equity put/call ratio spike climbing well above 1.0, proving the herd has finally flipped structurally bearish and marked a potential market bottom.
An explosive wave of call volume surrounding big tech hype on Tuesday, triggering an immediate contrarian short or premium-selling opportunity due to over-exhaustion.
The Final Pulse Verdict:
The retail herd is anxious but remains structurally net-long, buying fewer calls than a month ago but refusing to flip to puts. With institutions hedging at an aggressive clip, the massive divergence between retail call-buying and institutional put-buying is the single most critical sentiment signal on the board. It screams that volatility is coming. Trade smaller, honor your stops, and remember that when the trading forums are most confident, the tape is most dangerous.
Risk Management & The "Trading for a Living" Checklist
Trading SPY options for a living is not about identifying every market top and bottom. It is about surviving long enough for your statistical edge to compound. The levels identified in your playbook—$740.80, $747.29, $752.41—are irrelevant if you are sizing your trades like a gambler or managing your exits like a tourist. Everything analyzed above serves as input; this section is the anchor for your survival.
Position Sizing Framework (Based on $25K Account):
0DTE Directional (ITM/ATM): Limit to 2–3% of account ($500–$750 risk) using 2–3 contracts. The rationale is higher delta and lower theta bleed; you pay more up-front, but your P&L tracks the SPY price movement cleanly.
0DTE OTM (Lottery): Limit to 0.8% of account ($200 max) using 1–2 contracts. Accept a full loss as the likely outcome; treat this strictly as a convexity play.
0DTE Credit Spread: Limit to 1.2% margin using 1–2 spreads. Theta is your primary edge here; the risk is mechanical and defined rather than directional.
Weekly Directional: Limit to 3–4% of account ($750–$1,000 risk) using 2–3 contracts. You have more runway and less theta pressure here, justifying slightly larger sizing than 0DTE.
Earnings-Adjacent Play: Limit to 1.5% of account max ($375 risk) using 1–2 contracts. IV crush risk is severe, so cut your standard size by 50% on catalyst days.
The Hard Cap Rule: Never risk more than $750 on a single 0DTE position, and never risk more than $1,000 on a single weekly position. These are non-negotiable hard caps. If you are already at the cap and feel the urge to add, the answer is no.
Daily Loss Limits: The Circuit Breakers:
Yellow Flag (-$250 in a single day): Reduce the size of your next position by 50%. You are not permitted to enter any new positions larger than 1 contract until you are back in profit.
Red Flag (Daily Stop at -$500): Stop trading immediately. Close all open positions and walk away. There are no exceptions to this rule.
Nuclear (Weekly Stop at -$1,000 cumulative): Stop trading for the remainder of the week. Reset your mindset and your workflow on Monday.
Account Circuit Breaker (-$3,000 cumulative month-to-date): Halt all trading activity. Perform a deep review of every trade journal entry to identify the specific pattern bleeding capital before you resume.
The $500 daily stop is the most vital number in your plan. If your daily stop equals your daily target, you only need a 1:1 risk-reward ratio to break even. A 50% win rate at 1:1 with proper sizing will keep you in the game; a high win rate with poor risk-reward ratios will bleed the account to death.
Profit-Taking Milestones:
0DTE Exit Ladder
+25% of premium: Move your stop to breakeven. You are in the green; protect the capital. There is no such thing as a "free trade."
+50% of premium: Take 50% of the position off the table. Lock in the win and let the runner work with house money.
+75% of premium: Close the remaining position. 0DTE gamma is a double-edged sword; 75% is a gift—take it.
+100%+ of premium: Close the position immediately. Do not allow a 2x winner to become a 0.5x loser by holding into the final hour.
Note: All 0DTE directional positions must be closed by 3:30 PM ET unless you are in profit and trailing a stop.
Weekly Exit Ladder:
+30% of premium: Move stop to breakeven.
+60% of premium: Take 50% off the table.
+100% of premium: Close the rest or trail a stop at the 50% profit mark.
Time Stop: If the thesis has not played out in 3 trading sessions, exit. Do not hope for a reversal.
The "Trading for a Living" Daily Checklist:
Run through these items before every single trade to maintain your discipline.
Pre-Market (Before 9:30 AM ET):
[ ] Did I check overnight futures and pre-market SPY levels?
[ ] Where is SPY relative to the $740.80 "line in the sand"?
[ ] What is on the economic calendar today?
[ ] Are there earnings today that could spike IV?
[ ] What is my directional bias for the AM session?
[ ] What is my max loss for the day? ($500—write it down).
[ ] Am I emotionally neutral, or am I tilted from yesterday?
Pre-Trade (Before Every Entry):
[ ] Where is SPY relative to VWAP?
[ ] Am I in the first 15 minutes of the open? (If yes, wait unless testing a key level).
[ ] What is my entry level, target, and stop?
[ ] Is the risk-reward ratio at least 1:1?
[ ] Is this position within my $500 daily risk cap?
[ ] Do I already have 2 open 0DTE positions? (If yes, do not add).
[ ] Am I buying ITM/ATM for directional, or selling OTM for theta?
[ ] Did I size this position correctly?
Post-Trade (After Every Exit):
[ ] Did I follow the exit ladder or did I improvise?
[ ] Did I hit my stop, or did I move it?
[ ] Was the trade thesis valid, or was it a guess?
[ ] Log the trade: entry, exit, P&L, what worked, and what didn't.
[ ] Am I up or down on the day? How close am I to the stop?
End of Day (After 4:00 PM ET):
[ ] Did I close all 0DTE positions before 3:30 PM?
[ ] What is my daily P&L?
[ ] Am I up or down for the week? How close to the $1,000 weekly stop?
[ ] Did I journal every trade?
[ ] What did I learn today that makes tomorrow better?
Managing the Three Killers:
Revenge Trading: When you take a loss, get angry, and immediately re-enter a larger position to "make it back." The $500 daily stop is a hard circuit breaker. You do not get to make it back today; you make it back tomorrow with a fresh head.
Over-Sizing on Conviction: When you are "sure" about a move, you double your normal size. Your position sizing table is fixed. Conviction does not change your contract count. If you are more confident, enter the trade earlier—do not increase your size.
Holding Losers Past Stops: When the trade goes against you, you "give it room" by moving your stop. Your 15% stop is mechanical; it triggers, and you are out. You can re-enter if the setup re-establishes, but you never hope your way through a losing position.
Weekly Review (Every Friday After Close):
What was my total P&L for the week?
How many trades did I take? (Target: 8–12 for 0DTE/weekly).
What was my win rate and my average win vs. average loss?
Did I hit my $500 daily stop on any day?
Did I follow the exit ladder on every trade?
What was the best trade of the week and why?
What was the worst trade of the week and why?
What is one thing I will do differently next week?
The checklist does not make you money; it keeps you in the game long enough for the money to come. Treat every trade like it could end your account, because on any given day, it could.
Frequently Asked Questions: SPY Options Trading Playbook
What are the key SPY support and resistance levels this week?
For the week of July 20–24, 2026, all core targets are anchored directly to the previous session's close of $743.29:
Line in the Sand: $740.80 (Friday's low / Previous Day Low).
First Support Pocket: $739.51 (1-touch daily swing low).
Ultimate Structural Floor: $731.53 (Major 6-touch historical support).
Immediate Overhead Resistance: $747.29 (Friday's high / Previous Day High).
Major Overhead Resistance Walls: $749.53 (15 historical touches) and $752.41 (13 historical touches).
The Tactical Execution: As long as price action holds firmly above $740.80, the broad market structure remains entirely constructive. If sellers force a break below this line in the sand, look for an immediate test of $739.51. Losing that level opens up a clean structural breakdown toward the $731.53 floor.
2. Should I trade SPY or QQQ options this week?
For active, directional short-term options execution, QQQ stands out as the superior vehicle this week due to expanding volatility metrics:
Amplified Relative Volatility: QQQ navigated an aggressive $15.54 range ($686.76–$702.30) in the last session compared to SPY’s tighter $6.49 layout. On a percentage basis, tech moved 2.4 times more expansively than the broad market.
Heavyweight Tech Catalysts: Tesla (TSLA) and Alphabet (GOOGL)—both dominant top-5 components of the Nasdaq-100 index—report corporate earnings on Tuesday after the closing bell.
Sector Volatility Validation: Intel (INTC) reports earnings on Thursday, introducing further explosive move potential directly into tech premiums.
The Tactical Selection: Stick to SPY options when your game plan centers on broad-market range trading or systematic theta premium collection. Pivot to QQQ options when technology earnings act as the primary catalyst and your intraday execution demands higher gamma explosion per dollar of premium risk.
What is the best 0DTE SPY options strategy?
The optimal zero-days-to-expiration (0DTE) playbook relies entirely on matching your contract structure to current price velocity:
High-Conviction Directional Setups (Morning Momentum): Deploy In-The-Money (ITM) Calls or Puts utilizing a 0.55–0.65 Delta target. This strategy pays a higher premium up front to capture clean P&L correlation with underlying price movements while reducing immediate theta decay.
Moderate-Conviction Range Breaks: Deploy At-The-Money (ATM) contracts targeting a 0.45–0.55 Delta. This provides an optimal operational balance between delta sensitivity and premium costs when trading around scheduled economic releases.
Theta Harvesting Strategies (Consolidation Days): Sell Out-Of-The-Money (OTM) vertical credit spreads, targeting short contract Deltas between 0.20 and 0.30 to collect premium that rapidly decays to zero by the closing bell.
Core 0DTE Execution Rules:
Observe the Open: Never enter an options position during the first 15 minutes of the regular session. Allow opening algorithmic volatility to clear so a distinct daily range can establish.
Primary Entry Windows: Focus your execution strictly within the morning momentum window from 9:45 AM to 10:15 AM ET, or the afternoon volume return from 1:00 PM to 2:30 PM ET.
Hard Time Stop: Manually close out all active long directional 0DTE contracts by 3:30 PM ET. Do not hold collapsing options into the final 30 minutes when extreme gamma and pin risks peak.
Cap Your Exposure: Maintain a maximum of 2 open 0DTE positions at any single time. Never average down on a losing short-duration contract.
Best Premium-Selling Window: Friday afternoon offers the sharpest statistical edge for writing credit spreads due to rapid weekend theta acceleration.
Best Directional-Buying Window: Monday morning features clean implied volatility and predictable contract pricing before mid-week event risks build.
Can you trade SPY options for a living?
Yes, but long-term professional sustainability depends entirely on treating risk parameters like a strict business protocol. Here is the operational survival framework designed around a benchmark $25K account:
Daily Target Objective: $500.
Daily Maximum Loss Limit: $500 (A hard, automated circuit breaker—once hit, close your terminal and walk away for the session).
Weekly Maximum Loss Limit: $1,000 (An absolute halt on all trading activity for the remainder of the week to allow for an emotional reset).
Maximum Allocation Per Trade: Risk no more than $500–$750 per directional setup, capping risk at 2–3% of total account equity.
Strict Sizing Caps: Limit position scaling to 2–3 contracts maximum per intraday entry.
Mechanical Stop Loss: Enforce an invariant 15% maximum stop loss from your exact options entry price with no exceptions.
Mathematical Edge Baseline: Operating with a strict minimum 1:1 risk-to-reward ratio means you only require a baseline 50% win rate to net a consistent profit after transaction fees.
Traders who fail at this profession rarely do so because they lack technical charting skills; they fail because they lack the operational discipline to honor daily loss caps, over-size when they feel high conviction, and move stops back on losing positions.
What is the difference between trading SPY vs. SPX options?
Choosing between these two broad-market instruments depends on account sizing, holding times, and underlying execution strategies:
Notional Pricing Scale: SPY options track the retail ETF price level near $743, whereas SPX options track the ten-times larger underlying cash index level near $7,432.
Tax Efficiency Advantages: SPY gains are taxed at ordinary short-term capital gains rates. SPX contracts qualify for favorable Section 1256 tax treatment, fixing all realized profits at a blend of 60% long-term and 40% short-term capital gains rates regardless of contract holding times.
Liquidity and Execution Spreads: SPY delivers ultra-tight, single-penny bid-ask spreads optimized for retail day trading. SPX presents wider spreads due to its large institutional notional value.
Settlement Mechanics: SPY options feature physical share settlement upon expiration, exposing accounts to overnight assignment risk. SPX options settle entirely in cash, completely eliminating assignment exposure.
Strategic Optimization: SPY is built for agile day trading, precise fractional positioning, and rapid intraday scalp execution. SPX is optimized for institutional size, extended multi-hour holding periods, and tax minimization strategies.
When should I switch from SPY options to micro futures (/MES)?
You should actively pivot your capital to micro futures whenever rising implied volatility overinflates options premiums to expensive extremes. Ahead of major earnings catalysts, options strategies face an implied volatility tax that can crush long contract values even if you guess the underlying direction perfectly. Micro futures bypass this friction by providing pure, linear price exposure at a fixed value of $5 per S&P index point.
This instrument provides:
Absolute protection against sudden options volatility crush.
Zero daily theta time decay to fight during choppy, slow-moving sessions.
No complex option greeks or pricing variances to navigate.
Continuous 23/5 global market access running from Sunday at 6:00 PM ET through Friday at 5:00 PM ET.
The trade-off is the loss of options-style asymmetric gamma acceleration. While a 0DTE option can explode by 300% on a rapid 2-point market spike, an micro futures contract earns a linear return. Use micro futures when you want to avoid premium inflation, navigate overnight macro events safely, or trade pre-market hours before equity exchanges officially open.
What retail sentiment signals should I watch for trading SPY options?
The most high-probability sentiment edge on the tape right now is the massive, ongoing divergence between retail positioning and institutional hedging:
Retail Market Posture: The equity put/call ratio sits at a low 0.58–0.69, proving that retail traders remain stubbornly call-heavy and heavily biased toward chasing upside momentum.
Institutional Market Posture: The index put/call ratio has surged to an elevated 1.26, indicating that professional smart money is aggressively loading up on defensive put options to protect capital.
Broad Market Psychology: The Fear & Greed index has officially crossed out of Neutral territory and slipped to a reading of 37, indicating the early stages of market nervousness.
When retail aggressively buys calls while institutional desks aggressively buy puts, the resulting structural gap historically serves as a leading indicator for abrupt volatility spikes. This divergence signals that you must tighten your stop losses, scale back baseline position sizes, and respect the institutional hedge rather than assuming a quiet, low-volatility trading grind.
What earnings and economic events impact SPY this week?
This week marks the single heaviest volume stretch of the corporate earnings calendar, meaning micro-level corporate data will completely dominate macro-level Fed data:
Tuesday After Market Close — Tesla ($TSLA): Forecasting a revenue estimate of ~$27.58B (+23% Year-over-Year) and an EPS estimate of ~$0.88. Institutional focus will lock onto automotive margins and custom AI chip development progress.
Tuesday After Market Close — Alphabet ($GOOGL): Coming off an exceptional previous quarter that beat estimates by a massive 93%, setting a remarkably high bar for AI cloud monetization metrics.
Thursday — Intel (INTC): Targeting a revenue estimate of ~$14.3B with expected gross margins near 39%. The stock is under intense scrutiny after falling 9% during the recent semiconductor drop, making this a pivotal structural test for the broader technology trade.
Scheduled Economic Releases:
Monday, July 20 (10:00 AM ET): Conference Board (CB) Leading Economic Index for June, providing a baseline read on corporate trajectory.
Tuesday, July 21 (Intraday): S&P Global Flash Manufacturing and Services PMIs, offering the very first clear fundamental read on business activity for July.
Thursday, July 23 (8:30 AM ET): Initial Jobless Claims, serving as the primary baseline indicator for underlying labor market health.
Thursday, July 23 (10:00 AM ET): New Home Sales for June, mapping consumer strength following the prior month's contraction.
The Bottom Line Summary: With a relatively light economic calendar on deck, macro data will take a back seat to corporate performance. Tuesday afternoon's big tech reports will single-handedly establish the baseline direction for weekly volatility, while Thursday's data lineup represents the highest-risk execution session of the week.