
$TSLA Trading Plan: Navigating the Latest Musk Drama
With Elon Musk facing fresh legal heat and Tesla Energy scaling rapidly, one key price pivot will decide the entire week. Don't trade blind.
TECH STOCKSTECHNICAL ANALYSISSEMICONDUCTORS
Why $TSLA Still Commands Attention
Tesla isn't just a ticker; it is a structural lightning rod for the entire financial market. Trying to evaluate $TSLA purely as an automotive manufacturer is the quickest way for a trader to find themselves on the wrong side of the tape. It trades at the chaotic intersection of electric vehicles, global energy grid storage, artificial intelligence, robotics, and the personal, high-profile ecosystem of Elon Musk.
This multi-faceted identity ensures that $TSLA remains an absolute favorite for both long-term growth investors and high-frequency momentum traders:
The Valuation Paradox: Unlike legacy companies that trade on predictable, linear price-to-earnings multiples, $TSLA trades heavily on narrative, forward expectation, and sheer optionality. It is a stock where market sentiment and future milestones can cause explosive multi-day rallies or crushing corrections, completely independent of what the current quarterly earnings statement shows.
Built-In Volatility: Because of its massive retail following and heavy institutional options volume, $TSLA rarely moves in a quiet, orderly fashion. When a narrative shifts—whether it’s a sudden twist in Full Self-Driving (FSD) timelines or a delivery beat—the stock is notorious for fast, aggressive short squeezes and sharp liquidity flushes.
The Permanent Battleground: The constant tug-of-war between the bulls and the bears creates an evergreen trading environment. Bulls treat the company as an AI and robotics juggernaut with an unmatched tech moat. Bears focus on a highly premium valuation being squeezed by global EV competition. For active traders, this persistent structural friction means there is almost always a high-probability setup developing on the chart.
What Is Moving $TSLA Right Now
To trade $TSLA effectively today, you have to look well beyond simple vehicle production metrics. The current market environment is being shaped by three critical macro catalysts:
The Ascent of Tesla Energy:
While the media remains hyper-focused on quarterly vehicle delivery figures, smart money is increasingly looking at the utility-scale grid business. Wall Street estimates suggest that Tesla’s energy generation and storage division could pull in a staggering $18.3 billion this year. Products like the Megapack are scaling rapidly to support global power grids, shifting the company's revenue mix away from being a pure auto play. This high-growth energy storage segment is providing a vital buffer for the stock, especially when EV profit margins face near-term pressure.
Regulatory and Legal Friction:
There is a persistent cloud of headline risk hanging over the stock that active traders must account for. On the corporate side, federal scrutiny remains intensely focused on the safety parameters of Full Self-Driving (FSD) software following recent high-profile traffic incidents, such as the latest crash investigations in Texas. Simultaneously, personal legal distractions surrounding Elon Musk—including recent court orders forcing him to testify under oath regarding his controversial $1 million-a-day political giveaway lawsuit—continue to inject sudden, erratic volatility into the tape.
The Great Magnificent Seven Rotation:
The concept of the "Magnificent Seven" trading as one monolithic block is completely dead. We are currently witnessing a highly selective rotation inside mega-cap tech. Investors are no longer blindly buying the entire group; they are actively moving capital out of names facing near-term headwinds and concentrating it into specific AI and infrastructure leaders. $TSLA is constantly fighting for its share of this institutional capital allocation, meaning its price action is deeply tied to whether money is expanding into broader tech or seeking refuge in defensive pockets.
How to Read $TSLA Price Action and Sentiment
Reading the $TSLA tape requires a hybrid approach that respects pure technical analysis while closely monitoring the shifts in underlying market psychology. Because it is a highly emotional stock, the chart patterns function as a direct map of fear and greed.
Spotting Institutional Accumulation vs. Noise: $TSLA loves to form long, frustrating consolidation bases before breaking out into massive, multi-week macro trends. The key to filtering out fake-outs is volume validation. A headline-driven spike on low, average volume is usually a trap meant to capture late retail buyers. Conversely, when $TSLA reclaims a major structural moving average or horizontal zone on expanding, above-average institutional volume, it signals a true change in character.
The Interaction Between News and Structure: Sentiment and technicals go hand-in-hand here. When the macro news cycle is negative but $TSLA consistently refuses to break below a major historical support level, it tells you that the selling pressure is exhausted and smart money is quietly absorbing shares. On the flip side, if the stock fails to push higher on objectively good news, it’s a massive red flag indicating that institutions are using the liquidity to exit positions.
Focusing on Pivot Reclaims: One of the most profitable ways to read $TSLA's price action is to watch how it handles failed breakdowns. Because short interest is frequently high, if the stock slips below a clear support level, fails to attract heavy follow-through selling, and immediately reclaims that level, it often triggers a violent, automated short squeeze. Always look for structural confirmation rather than chasing the initial knee-jerk reaction.
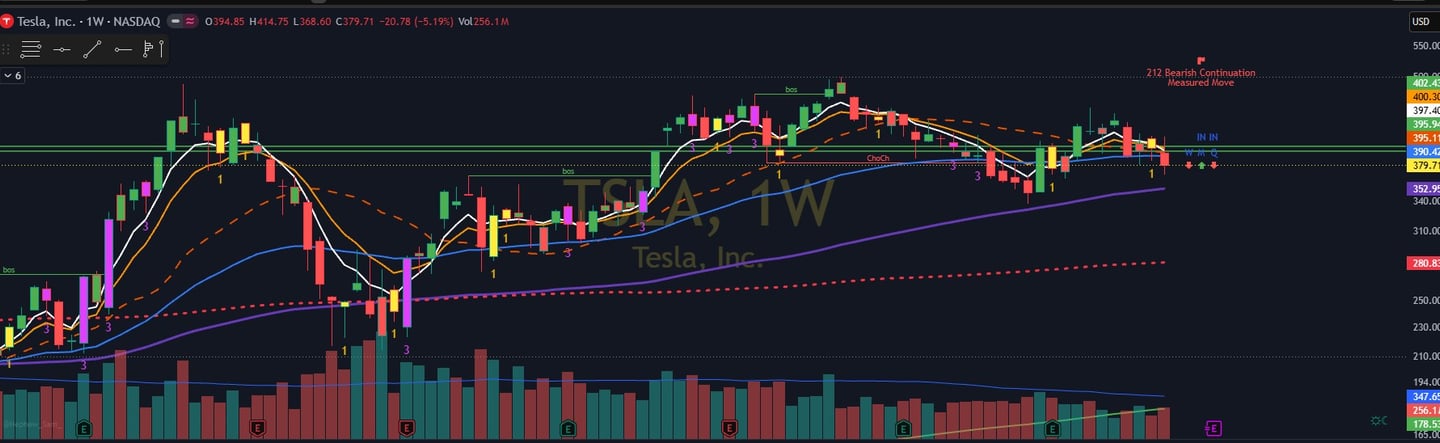
$TSLA Weekly Trading Blueprint: The Battlefield Map
Every successful trading week requires a clear map that separates the random noise from high-probability pivot zones. Below is the concrete tactical breakdown for $TSLA, mapping out the core bullish and bearish structures, the critical invalidation points, and the clear macro targets.
🚨 The Weekly Read: Line in the Sand:
The single most important level on the tape this week is $368.60. This is the ultimate "line in the sand" for the bulls.
If the market trades above it, buyers retain control and have the structural runway to squeeze shorts.
If the market trades below it, the bias shifts entirely, and sellers have the green light to press the tape down to deeper liquidity.
The Execution Framework:
🟢 The Bullish Playbook
To keep the upward auction healthy, the buyers have clear defensive and offensive goals this week.
The Must-Hold Floor: $368.60. Bulls need to aggressively defend this level on any pullbacks to prove they have the conviction to maintain control.
The Offensive Catalyst: If bulls can cleanly reclaim and hold above $387.53, the floodgates open for a massive weekly expansion upward.
Upside Targets:
Target 1: $387.53 (Initial supply zone / breakout trigger)
Target 2: $453.40 (Major structural extension)
Target 3: $498.83 (Psychological ceiling and key macro target)
🔴 The Bearish Playbook
For the sellers to reverse the macro momentum, they need to cap the market at supply and trap eager breakout buyers.
The Supply Ceiling: $387.53 to $387.80. This is the primary resistance band. Bears must firmly defend this pocket to prevent a bullish breakout and to force a rotation back down.
The Execution Cue: If $TSLA loses $368.60, the setup gets a lot uglier fast, indicating that the buyers have run out of steam and a deeper correction is underway.
Downside Targets:
Target 1: $368.60 (The bull pivot)
Target 2: $337.24 (The next real downside magnet)
Target 3: $273.21 (Deep liquidity pocket if macro selling pressure accelerates)
Tactical Cheat Sheet:
For quick reference during the trading session, keep these zones on your screen to identify which side has the immediate statistical edge:
$453.40 to $498.83 (Macro Extension Targets): Areas to aggressively lock in long profits as the market stretches into major daily supply.
$387.53 to $387.80 (Major Resistance Band): The main battleground overhead. Watch for bears to defend here, or for a massive bull breakout trigger if it clears and holds.
$368.60 (The Weekly Pivot): The core line in the sand. Trading above this favors the bulls; trading below favors the bears.
$337.24 (Structural Demand Floor): Critical downside target. If the pivot fails, expect price to gravitate toward this area like a magnet.
$273.21 (Deep Value / Liquidity Pocket): Major worst-case macro downside target if broader market weakness forces a heavy capital exit.
DISCLAIMER: Not financial advice. This is a market commentary piece based on current price action and options flow, and conditions can change quickly.