
$SPY Weekly Setup: The One Level That Could Decide the Whole Week
One specific $SPY price level is about to dictate the entire week's trend. Are you on the right side? Get the exact breakdown for bulls and bears.
SPY TRADINGMARKET INSIGHTSVOLATILITY
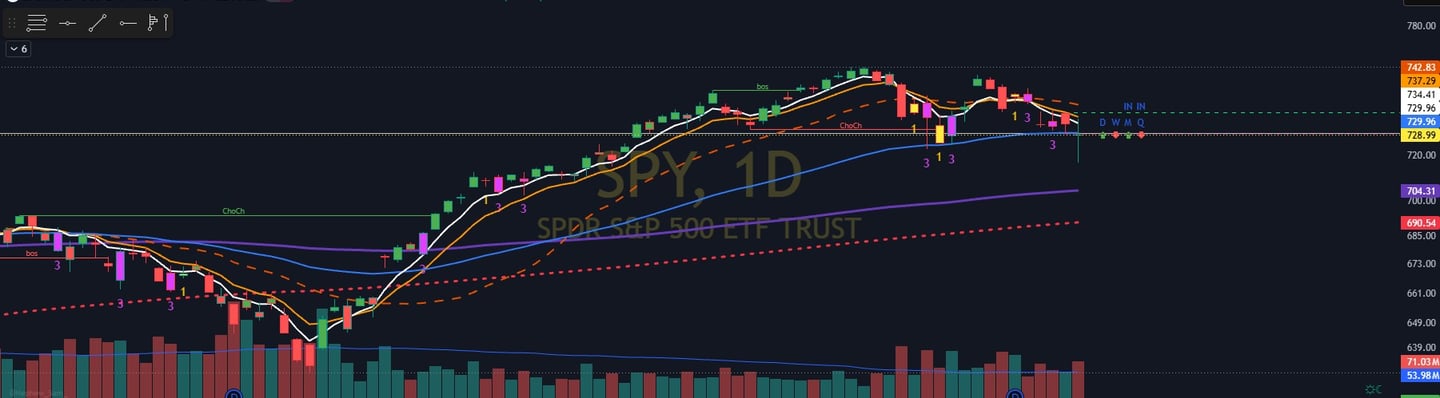
Table of Contents:
Why $SPY Matters to Traders and Investors
What Moves $SPY Prices
How to Read $SPY Price Action
$SPY Key Levels and Trade Plan
Why $SPY Matters to Traders and Investors
The SPDR S&P 500 ETF Trust, universally known by its ticker $SPY, isn't just another fund—it is the definitive pulse of the financial world. By tracking the S&P 500, $SPY aggregates 500 of the largest, most influential publicly traded U.S. companies into a single ticker. When institutional money managers, retail traders, or financial news anchors ask, "How is the market doing today?" they are almost always looking at $SPY.
For anyone navigating the markets, $SPY serves three critical roles:
The Ultimate Macro Proxy: Instead of analyzing hundreds of individual stocks, a quick glance at $SPY tells you exactly where institutional money is moving. It acts as a direct gauge for overall risk appetite. When $SPY is trending steadily upward, it indicates a healthy "risk-on" environment where buyers are confident. When it rolls over, it warns you that smart money is rotating out of equities and into safer havens.
Unmatched Liquidity: This is $SPY’s superpower. It sees massive daily trading volume, meaning the bid-ask spreads are razor-thin (usually just a penny). For active traders, this ensures hyper-efficient execution with minimal slippage. Whether you are trading shares or capitalizing on its highly active options market, you can enter and exit massive positions at a moment's notice.
The Universal Benchmark: Every portfolio manager's goal is to beat the S&P 500. For long-term investors, $SPY serves as the baseline metric for portfolio health. If your individual stock picks aren't outperforming $SPY over the long run, it signals that a simple passive indexing strategy might be the more efficient route.
What Moves $SPY Prices
Because $SPY is an index ETF, its price action is driven by a mix of massive macroeconomic forces and the individual performance of its heaviest corporate weights. To understand where $SPY is going, you have to monitor the primary catalysts that dictate its trend:
The Federal Reserve and Interest Rates:
The Fed is arguably the biggest driver of the broader market. When the Federal Reserve hints at lowering interest rates or maintaining a supportive, "dovish" monetary policy, cheap money flows back into the economy, fueling $SPY rallies. Conversely, when inflation remains sticky and the Fed threatens to raise or hold interest rates higher for longer ("hawkish" policy), borrowing costs increase, corporate valuations contract, and $SPY comes under immediate pressure.
Mega-Cap Tech Concentration:
It’s vital to remember that $SPY is a market-cap-weighted index. This means the largest companies hold an outsized influence over its daily movements. Tech heavyweights like $AAPL, $MSFT, $NVDA, And Amazon make up a massive percentage of the index's total value. Even if 400 of the smaller stocks in the S&P 500 are up on the day, a massive sell-off in just three or four tech giants can easily drag the entire ETF into the red.
High-Impact Macro Economic Data:
$SPY reacts violently to economic data releases because these reports reshape Wall Street's expectations for future economic growth. The most important reports to watch include:
CPI & PPI (Inflation Data): Tells the market if consumer and producer prices are heating up or cooling down.
Non-Farm Payrolls (NFP) & Unemployment: Measures the strength of the labor market.
GDP Print: Gives the definitive score on economic expansion or contraction.
Note: The market rarely reacts to the raw numbers themselves; instead, it reacts to how much those numbers deviate from expectations. A "bad" economic report can actually cause $SPY to rally if it forces the Fed to consider cutting interest rates sooner.
How to Read $SPY Price Action
Successfully trading $SPY requires filtering out the raw, minute-by-minute noise and focusing on pure market structure, volume, and context.
Identifying Market Structure:
Before placing any trade, you must identify the current environment. Is the market trending or ranging?
Uptrend: Characterized by a clean pattern of higher highs and higher lows. Buyers are aggressively defending pullbacks.
Downtrend: Defined by lower highs and lower lows. Sellers are actively pressing the tape and trapping aggressive buyers.
Chop / Balance: Price moves sideways between a defined support and resistance floor. This indicates a market waiting for a fundamental catalyst. Avoid over-trading inside these zones.
Volume Confirmation:
Price movement without volume is a trap. Volume tells you how much conviction is behind a specific move.
If $SPY breaks out over a key resistance level on heavy, above-average volume, it indicates major institutional participation and a high probability of follow-through.
If $SPY edges higher on weak, declining volume, the move is fragile and often leads to a sharp reversal.
Intraday Reference Points
Large institutions and algorithmic programs execute trades around the exact same key daily levels. By keeping these reference points on your chart, you can anticipate high-probability pivot areas:
Previous Day’s High (PDH) & Previous Day’s Low (PDL): Breaking outside of the prior day's range signals a shift in market balance.
The Opening Range (First 15–30 minutes): The high and low established right after the opening bell often dictates the tone for the rest of the session.
VWAP (Volume-Weighted Average Price): The ultimate baseline for intraday trend. Trading above VWAP favors long setups; trading below favors short setups.
$SPY Weekly Trading Blueprint: The Battlefield Map
Every successful trading week requires a map that separates the noise from high-probability pivot zones. Below is the concrete tactical breakdown for $SPY, mapping out the core bullish and bearish structures, the critical invalidation points, and the clear macro targets.
🚨 The Weekly Read: Line in the Sand:
The single most important level on the tape this week is $722.59. This is the ultimate "line in the sand" for the bulls.
If the market trades above it, buyers retain control and have the structural runway to squeeze shorts.
If the market trades below it, the bias shifts entirely, and sellers have the green light to press the tape down to deeper liquidity.
The Execution Framework:
🟢 The Bullish Playbook:
To keep the upward auction healthy, the buyers have clear defensive and offensive goals this week.
The Must-Hold Floor: $722.59. Bulls need to aggressively defend this level on any intraday pullbacks to prove they have the conviction to maintain control.
Hard Invalidation: $716.58. If $SPY breaks and accepts below this level, the structural integrity of the weekly long setup is severely compromised. If this level fails, step aside or pivot your bias.
The Offensive Catalyst: If bulls can cleanly reclaim and hold above $736.53, the floodgates open for a massive weekly expansion upward.
Upside Targets:
Target 1: $736.53 (Initial supply zone)
Target 2: $749.53 (Major structural extension)
Target 3: $756.68 (Acreage of new highs / psychological level)
🔴 The Bearish Playbook
For the sellers to reverse the macro momentum, they need to cap the market at supply and trap eager breakout buyers.
The Supply Ceiling: $731.53 to $736.53. This is the primary resistance band. Bears must firmly defend this pocket to prevent a bullish breakout and to force a rotation back down.
The Execution Cue: Look for signs of buyer exhaustion or a failed breakout (liquidity sweep) inside this resistance band to trigger short setups.
Downside Targets:
Target 1: $722.59 (The bull pivot)
Target 2: $716.58 (The structural floor)
Target 3: $708.37 (Major downside liquidity pocket)
Tactical Cheat Sheet:
For quick reference during the trading session, keep these zones on your screen to identify which side has the immediate statistical edge:
$749.53 to $756.68 (Blue Sky / Macro Targets): Areas to aggressively lock in long profits as the market stretches into new highs.
$731.53 to $736.53 (Major Resistance Band): The main battleground overhead. Watch for bears to defend here, or for a massive bull breakout trigger if it clears.
$722.59 (The Weekly Pivot): The core line in the sand. Trading above this favors the bulls; trading below favors the bears.
$716.58 (Structural Demand Floor): Critical bull defense zone. A break below this officially invalidates the long setups.
$708.37 (Deep Liquidity Pocket): The major downside magnet if macro selling pressure accelerates and support fails.