
Volume Analysis Mastery: How to Read Institutional Trading Activity
Master volume analysis to decode institutional buying and selling. Learn accumulation, distribution, and climactic volume patterns for high-probability trades.
Volume Analysis Mastery: The Institutional X-Ray (2026)
Introduction: The Only Truth in the Market
At Smart Trades Zone, we call Volume Analysis the "Institutional X-Ray." It is the only way to see what the "Big Boys" (hedge funds, pension funds, and investment banks) are doing behind the scenes. They can hide their intentions, but they cannot hide their size. This playbook will teach you to read the "Tape" and follow the smart money footprint.
Most retail traders obsess over price action alone. They stare at candlesticks, looking for patterns like "Head and Shoulders" or "Double Bottoms," and they wonder why those patterns fail 50% of the time. The reason is simple: price is just the effect. Volume is the cause. Price tells you where the stock went, but volume tells you how much conviction was behind the move. Think of price as a car and volume as the fuel in the tank. A car can look like it's speeding, but if the tank is empty, it’s just coasting on momentum and will soon stall.
Phase 1: The Core Principle – Effort vs. Result
The most powerful concept in Volume Analysis is the relationship between Effort (Volume) and Result (Price Change).
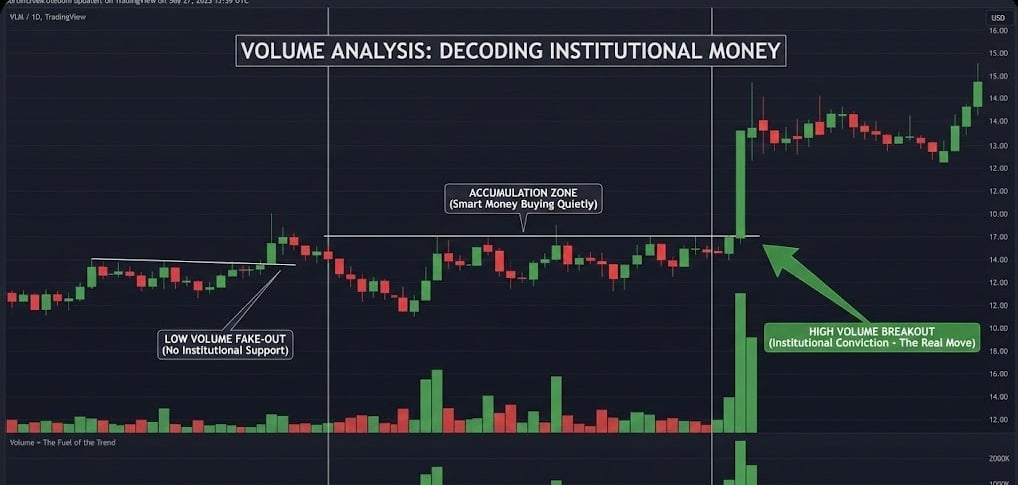
- Convergence (Strength): When price and volume move in harmony. If the price breaks out to a new high on massive volume, the effort is producing a result. This is a "healthy" move and highly likely to continue. This is the foundation of the high-probability entries we use in our [SPY Intraday Playbook], where volume confirmation separates a true trend from a morning fake-out.
- Divergence (Weakness): When price moves, but volume doesn't follow. If a stock hits a new high on lower volume than the previous high, you are looking at a "low-conviction" rally. The smart money isn't buying the breakout; only retail "FOMO" is left. This is a prime candidate for a reversal.
Phase 2: Identifying Accumulation and Distribution
Market cycles are driven by two phases: Accumulation (Smart money buying) and Distribution (Smart money selling). Volume is the only tool that reveals these phases before the massive price moves happen.
- Accumulation: Look for a stock trading in a tight sideways range where volume "spikes" on green days but stays "quiet" on red days. This indicates that institutions are patiently absorbing every share available without letting the price escape just yet. Once the "supply" is gone, the stock will explode higher.
- Distribution: This is the opposite. The stock may still be near highs, but you notice massive volume spikes on red days, while green days have lackluster participation. The "Big Boys" are unloading their positions onto retail traders who think they are "buying the dip."
Phase 3: The "Climactic" Volume Spike
One of the most profitable setups is identifying the Climax. This represents the end of a trend.
- Buying Climax: After a long uptrend, you see a massive, parabolic price jump accompanied by the highest volume seen in months. This isn't a sign of strength; it’s an "exhaustion" move. It represents the last of the retail buyers finally jumping in. Smart money uses this liquidity to exit. A reversal is imminent.
- Selling Climax (The Capitulation): After a long downtrend, a massive red candle on huge volume indicates that the last "weak hands" have finally panicked and sold. This "flush" often marks the exact bottom of a move. We frequently see these climactic events align with a vertical "exhaustion spike" in the [VIX fear index], marking a generational buying opportunity.
Phase 4: High-Probability Volume Setups
How do we turn this into a trade? We look for the Volume Breakout.
1. The Setup: A stock has been consolidating in a "flag" or "rectangle" pattern for several weeks. Volume should be drying up during this period, indicating a lack of interest.
2. The Trigger: A single daily candle closes above resistance. To be a valid "Smart Trades" setup, this candle MUST have at least 1.5x to 2x the average daily volume.
3. The Confirmation: If the breakout happens on "average" volume, we ignore it. It’s a "fake-out." We only bet when we see institutional fuel in the tank.
Phase 5: Reading the "Volume Profile" (Advanced)
Standard volume bars tell you when the buying happened. Volume Profile (Horizontal Volume) tells you at what price the buying happened.
- Point of Control (POC): This is the price level where the most volume was traded over a specific period. This acts like a magnet for price.
- High-Volume Nodes (HVN): These represent areas of "fair value" where the market is comfortable. They act as strong Support and Resistance.
- Low-Volume Nodes (LVN): These are "Value Gaps." Price tends to move through these zones very quickly because there is no historical supply or demand to slow it down.
Phase 6: The Psychology of the Tape
Volume is a measurement of emotion. High volume at a bottom equals Fear turning into Capitulation. High volume at a top equals Greed turning into Exhaustion. Rising volume in a trend shows Conviction, while falling volume shows Apathy.
Because volume-based moves can be explosive and fast, we never enter a trade without proper [Position Sizing Mastery]. The higher the volume, the higher the potential for slippage if the move reverses, making your mathematical risk-per-trade the most important number on your screen.
Summary: Believe Nothing But the Volume
Indicators like RSI or MACD are derivatives of price; they are "lagging" by definition. Volume is the only "leading" indicator because it represents the actual exchange of capital. If the volume doesn't support the move, the move is a lie. Follow the fuel, and you will find the profit.