
$TEM Stock Weekly Trading Plan: Critical Tempus AI Stock Levels
Tempus AI is coiled tightly near key moving averages after Cathie Wood's massive buy. Master the exact entry triggers and risk rules for $TEM this week.
TRENDING STOCKS
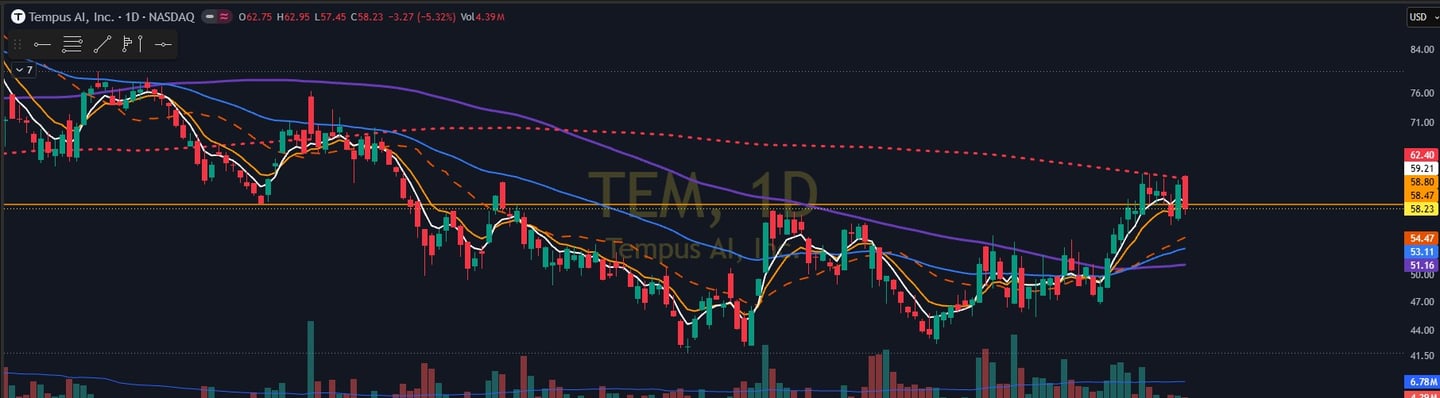
Table of Contents:
$TEM: Full Weekly Execution with Key Levels
Why Tempus AI ($TEM) is Trending This Week (And What to Watch)
Tempus AI ($TEM) has officially lit up trading terminal radars and Google Trends this week, quickly becoming one of the most talked-about momentum plays in the healthcare technology sector. While the broader indices are navigating dense macroeconomic inflation data, $TEM is breaking away from the standard market noise to move on highly aggressive institutional volume.
The stock has established itself as a major algorithmic battleground, drawing massive interest from both retail momentum chasers and institutional block-buyers. If you are swing trading options or monitoring high-beta growth setups, here is the exact breakdown of why Tempus AI is dominating the tape this week and the core catalysts driving the volume.
1. The Cathie Wood Accumulation Multiplier:
The primary spark behind the massive surge in search interest and trading volume is the relentless institutional accumulation from Cathie Wood and her team at ARK Invest. Throughout recent sessions, ARK has continued its aggressive pattern of loading up on shares, most recently adding a fresh block of 28,276 shares valued at over $1.73 million.
This continuous buying has vaulted Tempus AI into an elite status within the firm's portfolio:
A Top Conviction Play: Tempus AI now commands a massive position across ARK's combined exchange-traded funds, sitting firmly as a top-five core holding with an aggregate market value exceeding $438 million.
The Smart Money Signal: When an institutional fund systematically buys dips and accumulates a 4% total portfolio weight in an emerging technology name, algorithmic tracking systems flag the data. This creates a powerful snowball effect, forcing short-sellers to hedge their risk and enticing momentum desks to chase the tape.
2. The Pure-Play AI Healthcare Narrative:
Artificial intelligence remains the absolute dominant secular theme across global equity markets, but the market has grown fatigued of generalized software companies. Wall Street is actively looking for specific, verticalized AI applications that possess proprietary data moats—and that is exactly where Tempus shines.
Oncology and Precision Medicine: Tempus operates at the cutting edge of precision medicine, utilizing advanced machine learning algorithms to analyze vast libraries of clinical and genomic data to assist cancer treatments.
The Structural Demand Shield: Unlike consumer-facing applications, enterprise healthcare AI is heavily insulated from short-term retail spending slowdowns. This unique fundamental overlay makes $TEM an attractive hideout for growth capital looking to stay exposed to artificial intelligence infrastructure without being tied to the typical hardware or semiconductor bottlenecks.
3. Squeezing Out the Post-Earnings Disconnect:
Tempus AI has also entered a highly trended regime due to an acute fundamental and technical disconnect that occurred following its recent corporate scorecard release.
Beating Expectations: The company reported an impressive top-line financial beat and upwardly revised its forward revenue guidance metrics.
Defying the Bears: Despite printing stellar underlying numbers, early profit-taking and broader mid-summer liquidity constraints initially dragged the stock lower. This mechanical disconnect created a classic value gap. Now that the localized selling pressure has completely dried up, the stock is experiencing a violent counter-offensive as buyers reclaim the short-term moving averages and squeeze out late-to-the-game short positions.
4. Severe Technical Coiling inside a Clean Compression Zone:
From a purely structural perspective, $TEM has spent the last several sessions building a highly defined, mature accumulation base. After facing a persistent multi-month correction where shares were substantially discounted from their prior highs, the selling velocity has stalled out entirely.
The chart has formed a beautiful technical coil. Daily volatility is shrinking, and the price is pinching tightly right at the convergence of its short-term exponential moving averages. In the trading world, compression always precedes violent expansion. Active market participants are pile into the ticker this week because they recognize that the next multi-day directional trend is being decided right now.
Technical Architecture and Key Levels
To successfully trade Tempus AI ($TEM) this week, we have to analyze the massive architectural tug-of-war that unfolded during Friday’s closing bell. The stock printed a highly aggressive bearish reversal session, opening at the highs of $62.75, briefly tagging an intraday high of $62.95, and then selling off sharply throughout the day to close near the absolute lows at $58.23.
This flush carried massive institutional volume of 4.39 million shares and forced a clean close below both the intraday Volume Weighted Average Price (VWAP) of $58.61 and our primary weekly pivot line of $58.50. This confirms that institutional sellers completely controlled the tape into the weekend.
Looking at the multi-timeframe frame, $TEM is a volatility monster. The index recorded a massive $6.89 weekly range on a sub-$60 stock, highlighting an intense battle for value between growth bulls and macro bears.
The Moving Average Structure:
The structural indicators reveal a stark divergence between short-term momentum and long-term macro trend realities:
The Bullish Short-Term Stack: The stock’s immediate technical health remains positive. The 20-day Exponential Moving Average (20EMA) sits at $55.89, the 50-day Exponential Moving Average (50EMA) hovers at $53.11, and the 50-day Simple Moving Average (50SMA) rests at $51.36. Because price remains comfortably above this moving average cluster, near-term dip buyers are still technically in the game.
The Bearish Macro Ceiling: Despite the short-term strength, the long-term trend is still firmly down. The 200-day Simple Moving Average (200SMA) sits like a brick wall at $62.40. Friday’s high of $62.95 spiked directly into this macro average and was slapped down instantly. This precise rejection is the single most important technical signal on the chart heading into Monday morning.
The Multi-Timeframe Level Map:
Instead of guessing where the tape turns, map out these exact structural price zones from top to bottom:
The Absolute Ceiling ($63.11): This is the local period high and a zone of massive overhead supply sitting just above the macro moving average.
The 200SMA Resistance ($62.40): Primary institutional overhead resistance and our preferred structural short entry zone.
The Dynamic Pivot Zone ($58.50 to $58.61): The absolute line in the sand for early-week direction, representing the confluence of our core key level and Friday’s closing VWAP.
The Broken Resistance Floor ($58.04): A critical 3-touch swing high on both the daily and weekly charts that has now flipped into active support.
Friday’s Structural Low ($57.45): Immediate intraday support where the final defensive buyers stepped in before Friday's close.
Daily Major Support ($56.41): A historical 3-touch swing high zone that serves as a highly attractive liquidity magnet for short-sellers.
Daily Major Support ($54.75): Deeper structural support validating multiple historical inflection points.
Weekly Minor Support ($53.39): A major weekly swing low printed 12 months ago.
The Dynamic Macro Support ($51.36): The location of the rising 50SMA, marking the final line of defense for the broader bull thesis.
Sentiment Overhang and Catalysts:
While the structural charts are coiled tight, the underlying option market flow and fundamental background are painting a mixed narrative that traders must accommodate.
On the options tape, smart money is actively positioning for downstream downside protection. Institutional order flow recently flagged a heavy bearish call sweep totaling 308 contracts at the $75 strike expiring in late August, representing a cold $50.8K premium bet that the stock's upper boundary remains severely capped over the next several weeks.
Fundamentally, Wall Street research desks have begun anchoring the name near current prices, with major independent funds initiating coverage with a neutral hold rating and a $59 price target. Because this target aligns directly with our current closing zone, it signals to the market that $TEM is resting at a temporary "fair value" equilibrium.
The primary structural tailwind keeping the bullish healthcare-AI narrative alive is the broader sector expansion, fueled by massive independent machine learning model rollouts designed specifically for scientific drug discovery. This broader sector tailwind, combined with Tesla-like high-beta retail interest due to heavy political insider ownership disclosures, ensures that liquidity will remain exceptionally thick all week.
Tactical Daily Trade Executions:
To manage a standardized $25,000 active trading capital framework safely, we must account for structural margin realities. A 1,000-share position at these prices commands a total notional value of $58,230. While your 4x intraday buying power ($100,000) easily accommodates this size for day trades, your 2x overnight margin limit ($50,000) strictly forbids it. If you intend to swing any of these setups overnight, you must automatically scale your size down to a maximum of 800 shares or switch to options contracts to avoid margin liquidation.
Furthermore, throw out any rigid percentage-based stop loss rules. A standard 15% stop on a $58 stock places your risk all the way down at $49.50, exposing your account to an unacceptable $8,730 capital wipeout on a single bad position. Use the precise structural level invalidations mapped out below.
Scenario 1: The Key Level Bounce Long:
The Setup: Price successfully coordinates a defensive hold inside the $58.04 to $58.50 key pivot zone on Monday morning, printing a clear 15-minute bullish reversal candle (such as a hammer or morning star).
Execution Parameters: Enter long at $58.50 upon structural confirmation. Place a hard invalidation stop back below Friday's low at $57.45, exposing a tight $1.05 per share risk profile ($1,050 total risk on full day-trade sizing).
Upside Targets: Take initial profits at Target 1 ($60.09) for a 1.51 risk-to-reward ratio. Move stops to break-even and target Scale Zone 2 ($61.50) for a 2.86 ratio, leaving a small runner for Target 3 ($62.40) directly into the teeth of the 200SMA resistance ceiling.
Scenario 2: The 200SMA Breakout Long:
The Setup: Price violently reclaims the 200SMA at $62.40 on massive, expanding institutional relative volume and holds above the level for consecutive hourly sessions.
Execution Parameters: Enter long only upon a clean breakout confirmation print at $62.50. Because the true structural support sits all the way back down at our $58.50 key pivot zone, your stop loss must be placed there, exposing a massive $4.00 per share risk.
The Verdict: Skip this setup under normal conditions. This layout forces you to risk $4,000 across a standard block just to capture an initial target of 65.00,yieldingabrokenrisk−to−rewardratioofjust0.62.UnlessTEM drops a massive, unexpected corporate partnership or FDA announcement to fundamentally justify the wide risk, let this breakout pass or focus on the short side.
Scenario 3: The Pivot Zone Failure Short:
The Setup: Monday morning features a weak relief rally that tags the $58.50 to $58.61 VWAP zone, prints a clear 15-minute rejection wick, and fails to sustain structural acceptance above the line.
Execution Parameters: Enter short at $58.50 as the rejection confirms. Place your hard risk invalidation stop just above Monday's opening level at $60.10, maintaining a defined $1.60 per share risk parameter.
Downside Targets: Target 1 sits at the major daily S/R level of $56.41. If price fractures Friday’s low of $57.45, the downward momentum will accelerate rapidly into Target 2 ($54.75), yielding a 2.34 risk-to-reward ratio. Clear the final position at Target 3 ($53.39) near the major weekly support floor.
Scenario 4: The 200SMA Rejection Short (The Five-Star Setup):
The Setup: The index orchestrates a multi-day relief rally that drives price straight back into the macro 200SMA wall at $62.40, replicating Friday's exact failure profile.
Execution Parameters: Blindly shorting is high risk; instead, look to enter short at $62.40 the moment a lower-high signature prints against the indicator. Place a razor-thin structural stop at $63.20, positioned safely above the absolute period high of $63.11. This exposes an elite risk profile of only $0.80 per share.
Downside Targets: This represents the highest conviction setup of the week. Target 1 sits at your core $58.50 key level, unlocking an immediate, asymmetric 4.87 risk-to-reward payout. Leave a trailing runner for Target 2 ($56.41) to secure a phenomenal 7.49 total risk-to-reward capture.
Weekly Execution Rules and Operational Discipline:
To protect your capital profile across this volatile calendar, enforce these five mechanical execution filters:
The Opening 15-Minute Rule: Do not pre-position or guess the direction at Monday's opening bell. Let the first 15-minute candle print completely against the $58.50 pivot zone. If the candle holds above, execute the Scenario 1 long. If it prints a rejection body below, execute the Scenario 3 short.
The Multi-Day Scale Strategy: If the market gives you a gift and rallies into the $62.40 zone mid-week, drop all other biases and focus exclusively on hunting the Scenario 4 short. Friday already proved that institutions distribute heavily at that moving average.
The Position Duration Filter: Tempus AI is highly sensitive to news flow and sports a massive 12.3% weekly average range. If a trade does not format an immediate directional expansion move in your favor within 24 to 48 hours of your entry, execute a time-stop, flatten the position, and salvage your capital.
The Overnight Capital Cap: If you find yourself holding a winning intraday position into the 4:00 PM ET close and want to convert it to a swing trade, you must manually trim your exposure down to 800 shares or fewer before the bell to remain safely within your $50,000 overnight margin boundaries.
The Pre-Market Scan: Always check corporate wire feeds at 4:00 AM ET before market open. Because $TEM is an emerging AI-healthcare entity, sudden analytical upgrades, data collaborations, or corporate updates will completely invalidate prior technical structures before the opening bell.