
$TSLA Weekly Trading Plan: Critical Tesla Stock Levels
Tesla is tightly compressed between key moving averages after its delivery beat. Master the exact entry triggers and risk rules to trade $TSLA this week.
TRENDING STOCKS
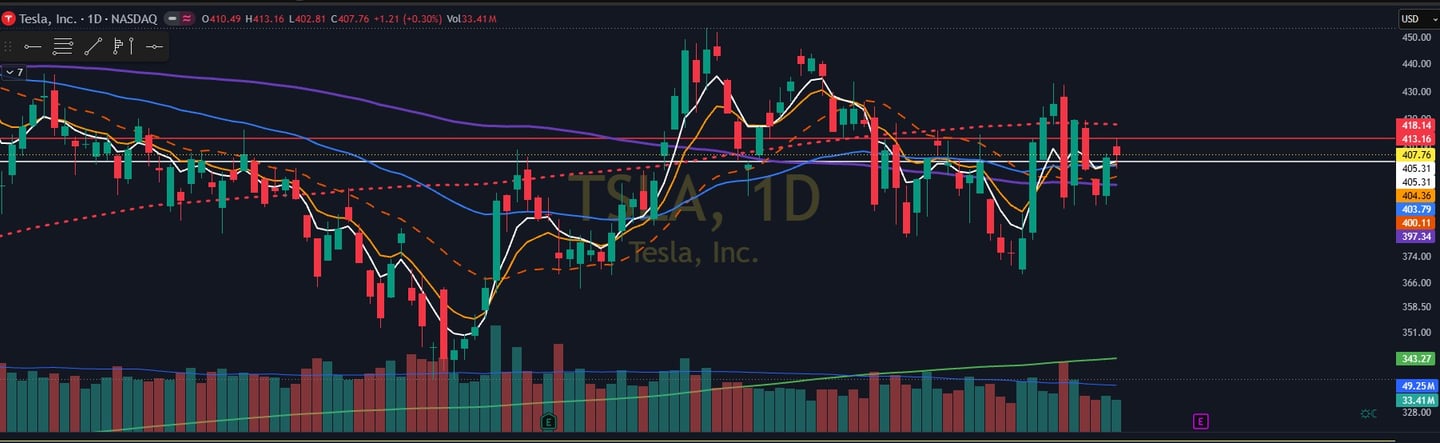
Table of Contents:
$TSLA: Weekly Trade Plan with Key Levels
Why $TSLA is Trending This Week (And What to Watch)
Tesla ($TSLA) remains the ultimate battlefield stock for retail and institutional traders alike, and this week is no exception. The stock is currently trading within a tight, high-volume range around the $406 to $414 mark, consolidating its recent moves and establishing a distinct structural base. While the broader market is hyper-focused on macroeconomic inflation prints, $TSLA is moving to its own idiosyncratic rhythm as it marches toward an incredibly critical corporate catalyst window.
Whether you are swing trading weekly options contracts or managing long-term equity size, the stock is experiencing a massive surge in institutional order flow. Here is exactly why $TSLA is dominating the financial conversation right now, and the core factors you need to monitor on your layout.
1. Absorbing the "Sell-the-News" Volume from Record Deliveries:
The initial spark for the recent volatility came from Tesla's massive second-quarter production and delivery report. The company shocked the street by delivering 480,126 vehicles, soundly beating the consensus estimate by roughly 18%. Crucially, deliveries outpaced the 451,758 vehicles produced during the quarter, signaling a substantial drawdown of excess inventory that had heavily weighed on cash flow in previous periods.
Despite the stellar operational beat, the stock suffered an immediate, sharp drop of roughly 7% to 8% as institutional algos executed a classic "sell-the-news" profit-taking event following the massive run-up into the print. This week, $TSLA is highly trended because that heavy post-delivery selling pressure has finally dried up, and the stock is actively squeezing short-sellers who overextended at the local lows.
2. High-Stakes Pre-Earnings Positioning:
We have officially entered the high-stakes pre-earnings quiet window, with Tesla confirmed to report its Q2 financial results on Wednesday, July 22. Because Wall Street already has the exact delivery volume numbers, this upcoming report is entirely a story about automotive gross margins and the raw financial cost of their current infrastructure expansion.
Options implied volatility is expanding rapidly this week as traders price in the upcoming report. Top Wall Street analysts are actively revised their price targets—with several projecting a notable earnings beat—which keeps daily liquidity incredibly thick as institutions position their blocks ahead of next week's numbers.
3. The Structural Shift to an Autonomy Play:
Tesla continues to trend heavily because its premium valuation multiple—trading at a steep forward price-to-earnings ratio—makes it clear that the market is no longer pricing this as a simple car manufacturer. Instead, it is being valued as an artificial intelligence, robotics, and full autonomy ecosystem.
Traders this week are closely watching the underlying metrics of Tesla's robotaxi network expansions across major metropolitan test beds. Furthermore, reports of strict internal corporate cost controls—such as capping employee third-party AI tool spending—highlight just how aggressively management is trying to optimize cash conservation so they can funnel billions into raw compute power and machine learning architecture.
4. Technical Compression and Critical Chart Levels:
From a purely technical perspective, $TSLA has carved out a beautiful, highly defined trading setup. After the post-delivery flush down into the $391 to $395 zone, buyers stepped in aggressively to defend a major ascending trendline and a key Fibonacci retracement level.
The stock has spent the last few sessions compressing tightly just above its short-term moving averages. This week, the chart is a absolute powder keg. A clean, high-volume break and hold above the psychological $412 to $415 overhead resistance level opens up a rapid technical vacuum toward the prior channel highs near $428 to $438. On the flip side, if the stock fails to sustain this level and breaks back under $395, the short-term bullish thesis is completely invalidated, exposing the tape to a much deeper macro correction.
TSLA Weekly Trading Plan: July 13–17, 2026
Friday Session Recap:
Tesla headed into the weekend on a completely neutral footing. During Friday's session, the stock opened at $410.49, caught a high of $413.16, flushed to a low of $402.81, and ultimately crossed the finish line at $407.76 (with after-hours ticking just a fraction lower to $407.59).
The total intraday range spanned $10.35, representing a 2.54% move. Because the final print landed exactly 47.8% of the way from the absolute low to the high, it tells us that neither the bulls nor the bears established true conviction. We are entering the new week in a state of short-term equilibrium.
Moving Average Structure: The Story Behind the Levels:
The true narrative of this chart lies within its moving average configuration. Right now, $TSLA is wedged in a massive technical compression zone, and a major explosive expansion move is brewing.
The Short-Term Momentum Floor (5EMA at $405.31): The closing price sits $2.45 above this line, keeping immediate, micro-bullish momentum technically intact.
The Intermediate Floor (50MA at $403.79): The close resides $3.97 above this level, reinforcing near-term structural support.
The Macro Ceiling (200MA at $418.14): The stock remains $10.38 below this heavy institutional benchmark, maintaining a macro-bearish bias.
The Crucial Takeaways: The short-term trend is fighting the macro trend. Because the 5EMA sits slightly above the 50MA, near-term momentum is positive. However, both of these indicators are trapped beneath the 200-day Moving Average. This creates a classic death cross structure, signaling that the stock is still trading underneath its primary macro trend line.
The 200MA at $418.14 serves as a hard institutional ceiling. Until buyers can forcefully reclaim it, the long-term trend remains down. With price tightly squeezed between the moving average confluence below ($403.79 to $405.31) and a stack of horizontal resistance overhead,$TSLA is coiled tight. Expect this compression to resolve violently this week.
The Key Level Map:
To trade this setup cleanly, map out these exact technical milestones on your chart from highest to lowest:
Ultimate Weekly Resistance ($453.40): The reigning period high and far-extended bull target.
Daily Major Resistance ($432.86): An intermediate upside target.
The Macro 200MA ($418.14): Major structural resistance and the primary upside target for a full trend reversal.
Daily Major Resistance ($416.00): A heavy horizontal ceiling boasting 6 historical validation touches.
Daily Minor Resistance ($414.75): An intraday speed bump.
Previous Daily High / PDH ($413.16): The immediate overhead resistance from Friday.
Daily Major Resistance ($409.28): The first local barrier above the current price, validating 3 historical touches.
The Baseline Close ($407.76): Friday's closing market price.
Friday's Open ($410.49): A key psychological overhead level.
The 5EMA Pivot ($405.31): Crucial short-term daily structural support.
The 50MA Support ($403.79): The core intermediate moving average baseline.
Previous Daily Low / PDL ($402.81): The immediate low-of-the-week defense line.
Daily Major Support ($393.63): A major horizontal floor backed by 9 distinct chart touches.
Daily Major Support ($380.15): Deep structural support validating 4 historical touches.
Daily Macro Support ($368.60): The defining low of the macro chart structure.
The Critical Inflection Zone ($403.79 to $405.31):
The 5EMA and the 50MA are hovering just $1.52 apart, forming an incredibly potent confluence zone that serves as the absolute line in the sand for the week.
Note how close Friday’s low ($402.81) sits to this zone—just $0.98 below the 50MA. This means if Friday's low fractures on volume, both major moving averages fail simultaneously, likely triggering a cascading bearish signal. Conversely, if buyers aggressively defend this zone, it establishes a high-probability spring board to launch price straight into the overhead resistance gauntlet.
TSLA-Specific Catalysts This Week:
While the broader market will be reacting to macroeconomic events like CPI and PPI, Tesla has a heavy, conflicting fundamental narrative stream of its own that is creating intense tug-of-war dynamics.
The Bullish Case:
Q2 Delivery Beat: Tesla shocked the market by delivering 480,126 units against the consensus expectation of roughly 406,000. This represents an impressive 25% year-over-year increase and a massive 34% quarter-over-quarter acceleration.
Global Dominance: The Model Y officially clawed its way back to claim the title of the absolute best-selling vehicle in China for the month of June.
Wall Street Upgrades: Institutional analysts have aggressively raised their outlooks, with major firms shifting price targets upward to the $442 and $500 ranges.
Tech and Robotics Advancements: The Full Self-Driving (FSD) ecosystem continues to progress with natural-language voice command integrations for drop-offs, while the underlying institutional Optimus humanoid robot narrative builds long-term premium valuation support.
The Bearish Case:
Valuation and Demand Concerns: Notable fund managers have pointed out that Tesla's valuation remains hyper-stretched, deterring many strict institutional value investors. Critics argue the recent delivery spike was artificially driven by temporary, war-induced gasoline price spikes rather than sustainable organic demand.
Regulatory Cracking: The National Highway Traffic Safety Administration (NHTSA) is intensifying its scrutiny on autonomous vehicles, citing patterns of first-responder interference and demanding firm technical fixes.
State-Level Hurdles: A newly proposed bill in New Jersey threatens to heavily restrict robotaxi operations if it mandates mechanical LiDAR or radar hardware, directly attacking Tesla’s camera-only vision approach.
Capital Expenditure Drags: Joint semiconductor and infrastructure projects have pushed projected capex toward massive boundaries, causing the company to hint at potential negative free cash flow phases later this year.
Daily Execution Guidelines
Monday, July 13: The Setup Day:
Bias: Purely neutral. The stock closed dead-center of its daily range. We have no clear mathematical edge until the tape forces a direction away from the moving average confluence zone.
What to watch: Monitor the overnight futures open for any gaps away from the $407.76 close. In the morning, check if pre-market trading stays securely above the 5EMA ($405.31). Look at $409.28 as the first major test of strength; if buyers fail to clear this local 3-touch resistance early, it signals underlying weakness.
Trade Plan A (The Long Setup): If price firmly holds above $405.31 at the open, look for long entries on brief, constructive pullbacks. Targets are set sequentially at $409.28, $413.16 (PDH), and $416.00. Place a hard invalidation stop on a clean daily close below the 50MA ($403.79).
Trade Plan B (The Short Setup): If the market opens weak and executes a high-volume breakdown below the 50MA ($403.79), look to short the break of the confluence zone. Targets sit at $393.63 (strong 9-touch support) and $380.15. Your risk invalidation is a clean reclaim back above the 5EMA ($405.31).
Tuesday, July 14: CPI and Bank Earnings:
The Scenario: CPI data drops at 8:30 AM ET. Because of Tesla's massive growth multiplier, a hot inflation print will immediately trigger a valuation flush, whereas a cool print will weaponize the delivery beat narrative for a squeeze toward the 200MA.
Pre-Market Rule: Flatten your short-term tactical positions completely before 8:30 AM ET. Do not gamble through a high-beta macro print.
Scenario 1 (Hot CPI): If price violently slices through the moving average floor ($405.31 to $403.79) and breaks Friday's low ($402.81), enter short. Target the major $393.63 support floor. Stop out if the stock manages to reclaim $405.31.
Scenario 2 (Cool CPI): Look for an aggressive momentum breakout. Enter long upon a clean break and hold above the $409.28 horizontal resistance. Targets sit at $413.16, $416.00, and the ultimate macro 200MA at $418.14. Place a tight stop back under the 5EMA ($405.31).
Scenario 3 (In-Line CPI): Expect a heavy intraday chop between the $403.79 floor and the $409.28 ceiling. Step aside and let broader financial sector earnings dictate the macro risk appetite before entering the tape.
Wednesday, July 15: PPI and Fed Testimony:
The Scenario: June PPI drops at 8:30 AM ET, while congressional testimony from the Federal Reserve Chair will keep interest rate sensitivity running hot.
If Tuesday closed bullish (Above $409.28): An analytical macro continuation brings the $413.16 and $416.00 targets into immediate view. Treat any morning retests of the old $409.28 ceiling as high-probability long entry entries. If price reaches the macro 200MA ($418.14), ruthlessly lock in profits—this level will not break without an incredibly fierce institutional battle. Stop out if price falls back below the $407.76 baseline.
If Tuesday closed bearish (Below the 5EMA): A hot PPI print will accelerate a move lower. Focus exclusively on short setups on any shallow relief rallies back into the $405.31 to $407.76 zone, targeting the $393.63 support. Invalidation triggers instantly if a 15-minute candle reclaims and prints above $405.31.
Thursday, July 16: Retail Sales and Macro Squeezes:
The Scenario: Retail Sales data drops at 8:30 AM ET. Remember to recalculate the dynamic 5EMA position on your chart before the opening bell, as it will have shifted locations based on the week's realized price action.
The Upside Story: If the stock has been grinding steadily higher, Thursday presents a potential showdown with the heavy 6-touch resistance at $416.00 and the 200MA at $418.14. If price flags tightly under $416.00 and breaks through, it triggers a powerful macro structural regime shift. If it rejects $416.00 early, exit longs completely, as a broader breakout will likely wait until the upcoming earnings report.
The Downside Story: If the stock has been grinding lower all week toward the $393.63 support floor, Thursday often acts as an intraday exhaustion day. Avoid shorting into the absolute lows. Look for a counter-trend bounce, using a reclaim of the dynamic 5EMA on a 15-minute close to signal a minor long relief play.
Friday, July 17: Position Management and Risk Reduction:
The Rule: Friday is dedicated entirely to locking in your realized weekly P&L. Do not start fresh, aggressive risk parameters ahead of the weekend.
Execution Strategy: If the stock is trading in a bullish regime above the 5EMA, trim your remaining trailing positions directly into the $416.00 to $418.14 macro overhead supply wall. If the stock is trapped in a bearish regime below the moving averages, treat any afternoon short-covering spikes back up toward $405.31 as an exit window to liquidate your positions. Ensure you are entirely flat and sitting in cash by 3:30 PM ET to eliminate weekend geopolitical gap risk.
Core Risk Management Blueprint:
To defend your trading capital against high-beta volatility, operate strictly within these predefined operational boundaries:
Account Sizing Baseline: Standardized against a disciplined $25,000 active capital allocation.
Primary Technical Compass: The dynamic 5-day Exponential Moving Average ($405.31 baseline).
Intermediate Structural Pivot: The 50-day Simple Moving Average ($403.79 baseline).
The Weekly Institutional Ceiling: The macro 200-day Moving Average ($418.14 baseline).
Maximum Position Risk Parameter: A non-negotiable hard stop capped at a 15% maximum premium or value loss on any single trade entry.
Long Invalidation Trigger: A clean daily candle close below the 50MA floor ($403.79).
Short Invalidation Trigger: A sustained intraday reclaim and acceptance above the 5EMA ceiling ($405.31).
Weekend Capital Protection Mandate: Flatten all derivative and equity swing risk by 3:30 PM ET on Friday. Ongoing regulatory deadlines and geopolitical variables make holding exposure over the weekend highly disadvantageous.