
Chart Pattern Breakouts: Trade High-Probability Setups
Master profitable chart patterns like triangles, flags, head-and-shoulders, and cup-and-handle. Learn which patterns work, how to confirm breakouts, and maximize your risk/reward on every trade.
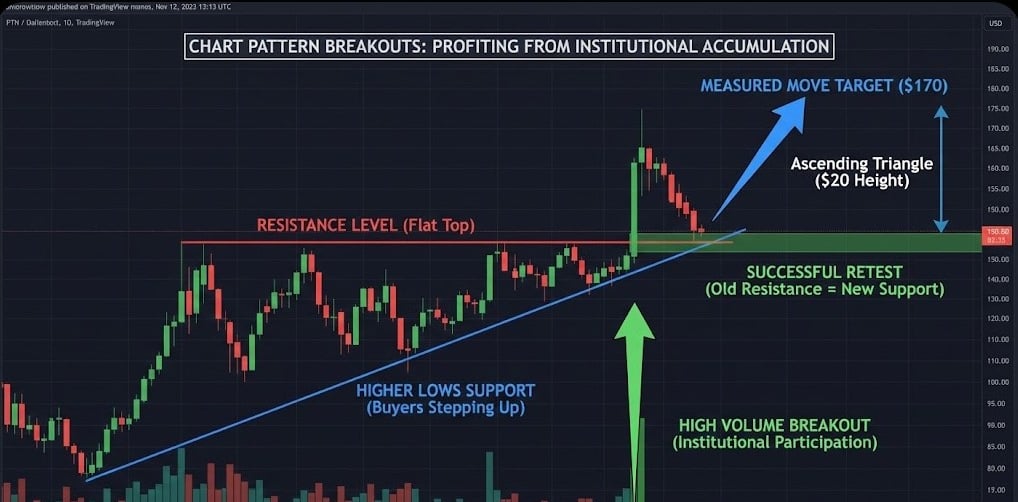

Chart Pattern Breakouts: Trading the Geometry of Greed (2026)
Introduction: The Psychology of the "Pressure Cooker"
At Smart Trades Zone, we don't view patterns as random shapes. We view them as psychological "pressure cookers." The longer a stock stays within a pattern, the more pressure builds. When that pressure is finally released, it creates the high-velocity breakout opportunities that build empires. This playbook will teach you to identify the most reliable continuation and reversal patterns, ensuring you are positioned for the "Big Move" before it leaves the station.
While a single candlestick shows you the battle of the day, a chart pattern shows you the war of the month. Chart patterns are the footprints of institutional accumulation and distribution. They represent periods where the market is "recharging its batteries"—consolidating energy before a significant breakout or breakdown occurs.
Phase 1: The Three Stages of a Professional Breakout
To trade patterns successfully, you must understand the lifecycle of a breakout. Most retail traders fail because they enter at the wrong stage, usually chasing a move that is already overextended.
1. The Consolidation: Price moves sideways within defined boundaries of supply and demand. Volume typically dries up as the market reaches an equilibrium.
2. The Break: A single candle closes decisively outside the boundary. This must be confirmed by the "Institutional Fuel" found in our [Volume Analysis Mastery] guide.
3. The Retest (The Gift): Often, price will return to touch the broken boundary. This "Role Reversal" is the highest-probability entry point for professional traders, offering the best reward-to-risk ratio.
Phase 2: High-Probability Continuation Patterns
Continuation patterns tell you that the dominant trend is just taking a breather.
- The Bull Flag: After a vertical price spike (the "pole"), the stock drifts lower in a tight channel. This represents healthy profit-taking.
- The Ascending Triangle: A flat top resistance combined with rising support. This shows that buyers are becoming more aggressive, buying every dip at higher levels.
- The Cup and Handle: A long, "U-shaped" recovery followed by a small handle just below resistance. This is a classic sign of massive institutional accumulation.
Phase 3: High-Probability Reversal Patterns
These patterns signal that the current trend is exhausted and a "Change in Character" is imminent.
- Head and Shoulders (Top): Three peaks, with the head being the highest. When the "Neckline" (the floor of the pattern) breaks, the bull market is officially over. This is a critical signal to consult your [Support & Resistance Playbook] to identify the next major demand zone.
- Double Bottom (W-Pattern): The stock hits a low twice and finds strong demand. This "W" shape indicates that the bears have lost their power.
Phase 4: The Volatility Contraction Pattern (VCP)
In 2026, the VCP is the secret weapon of the elite breakout trader. It occurs when a stock goes through a series of "tightening" price swings. For example, the first dip is 20%, the next is 10%, and the final dip is only 3%. This tells you that the "Weak Hands" have been shaken out and there is almost no supply left. When a VCP stock breaks out, it often moves 20% or more in a matter of days.
Phase 5: The "BS Detector" – Volume Confirmation
A chart pattern without volume analysis is just a drawing.
- Real Breakout: Price breaks resistance AND volume spikes at least 100% above the 20-day average. This shows institutional commitment.
- Fake-out: Price breaks out but volume remains flat. This indicates that only retail traders are "chasing" the move, and the smart money is about to slam the price back down (a "Bull Trap").
Phase 6: Calculating Your Target – The Measured Move
One of the greatest advantages of chart patterns is the "Measured Move" formula, which provides a mathematical profit target before you enter.
Formula: Measure the vertical height of the pattern (from the floor to the ceiling). Add that same distance to the breakout point. If a triangle is $10 tall and breaks out at $100, your primary profit target is $110. This removes the "greed" factor, giving you a clear exit point.
Phase 7: The "Failed Pattern" Setup
One of the most profitable trades is the "Failed Pattern." If a Head and Shoulders Top forms (bearish) but then suddenly breaks out to a new high instead of breaking the neckline, it triggers a massive "Short Squeeze." This is because every person who shorted the "pattern" is now trapped and must buy to cover. We look for these failures as they often lead to the most explosive moves in the market.
Phase 8: Risk Management – The Exit Strategy
Even the most beautiful pattern can fail. Your survival depends on standardized risk.
- Stop Placement: For a bullish breakout, your stop loss should be placed just inside the pattern, typically below the most recent swing low.
- Standardized Sizing: Because breakout volatility can be extreme, we utilize [Position Sizing Mastery] to ensure that a failed breakout only costs us 1% of our total account equity. Never risk more on a "perfect" pattern than you would on any other trade.
Summary: Pattern Recognition is Wealth Recognition
Chart patterns are the visual language of the market's supply and demand balance. By mastering the Flag, the Triangle, and the VCP, you stop reacting to random noise and start anticipating high-probability shifts in momentum. Let the retail traders guess; you will wait for the break, confirm the volume, and ride the trend to the measured move target.