
RSI & MACD Trading: Master Momentum Indicators for Entries
Master RSI and MACD for high-probability trades. Learn overbought/oversold signals, divergence trading, MACD crossovers, and how to combine both indicators for precision entries and exits.
RSI & MACD Playbook: Mastering Momentum Confluence (2026)
Introduction: The Power of Momentum Confluence
At SmartTradesZone, we don't believe in trading with "blindfolds" or relying on gut feelings. We seek Momentum Confluence by layering the speed of the RSI with the structural strength of the MACD to ensure every entry is backed by mathematical conviction. This playbook is designed to help you strip away the market noise and identify the exact moments when institutional momentum shifts, allowing you to ride the "tidal waves" of the market while others are caught in the ripples.
In the fast-paced world of trading, price action is the king, but momentum is the engine that drives it. Many traders struggle because they rely on a single indicator that often gives false signals in choppy markets. At Smart Trades Zone, we don't guess—we seek confluence. By combining the Relative Strength Index (RSI) and the Moving Average Convergence Divergence (MACD), you gain a multi-dimensional view of the market.
The RSI tells you the speed of the price movement, while the MACD tells you the strength and direction of the underlying trend. When these two high-power oscillators align, you are no longer trading on hope; you are trading on a mathematical probability. This playbook will teach you how to use these indicators to identify high-probability entries, spot reversals through divergence, and time your exits with institutional precision.
Phase 1: Understanding the Relative Strength Index (RSI)
The RSI is a momentum oscillator that measures the speed and change of price movements on a scale of 0 to 100.
- Overbought (Above 70): When the RSI crosses above 70, it indicates that the stock may be overextended to the upside. While this doesn't mean you should short immediately, it is a warning that a pullback or consolidation is likely.
- Oversold (Below 30): When the RSI falls below 30, it suggests that selling pressure is exhausted and a bullish reversal or bounce may be imminent.
- RSI Midline (50): The 50 level acts as a "trend barometer". If the RSI is consistently staying above 50, the bulls are in control. If it's below 50, the bears have the upper hand.
Phase 2: Decoding the MACD (Moving Average Convergence Divergence)
While the RSI measures price speed, the MACD measures trend strength and direction by comparing two moving averages.
- MACD Line & Signal Line: The primary signal occurs during a "Crossover". A bullish crossover happens when the MACD line crosses above the Signal line below the zero axis.
- The Histogram: This visualizes the distance between the MACD and Signal lines. Growing bars indicate expanding momentum; shrinking bars suggest a trend is losing steam.
- The Zero Line Equilibrium: The zero line is the "sea level" of the MACD. When the MACD line is above zero, the short-term average is above the long-term average, indicating bullish momentum.
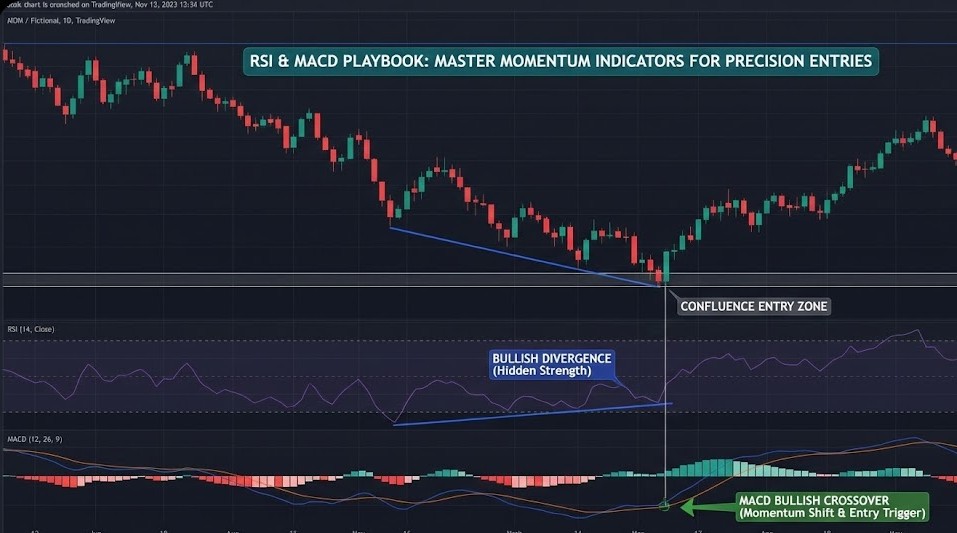
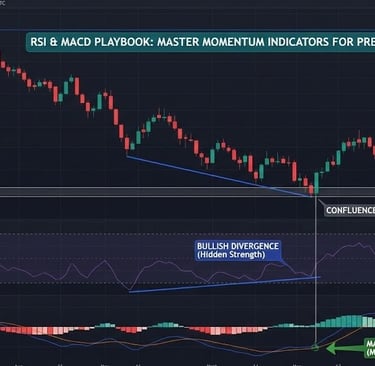
Phase 3: The Ultimate Combo Setup – The Confluence Strategy
The "Holy Grail" of momentum trading is seeing both indicators confirm each other at major price levels.
1. Step 1: Identify Location. Wait for price to approach a major [Support & Resistance Playbook] zone.
2. Step 2: Check RSI. Look for an oversold reading (below 30) at support or an overbought reading (above 70) at resistance.
3. Step 3: Wait for MACD Confirmation. Do not enter on the RSI alone. Wait for a MACD bullish crossover to confirm that buyers are actually stepping back in.
This confluence dramatically reduces false signals and ensures you are entering when momentum is officially shifting in your favor.
Phase 4: Trading Divergence – The Professional's Edge
Divergence occurs when price action and indicators disagree, often providing the earliest warning of a major trend reversal.
- Bullish Divergence: Price makes a "Lower Low," but the RSI and MACD make a "Higher Low". This shows that even though the price is dropping, the selling pressure is actually weakening. The smart money is buying the dip quietly.
- Bearish Divergence: Price makes a "Higher High," but the indicators make a "Lower High". This is a massive red flag that the current rally is being driven by "low conviction" and a crash may be coming. For the most reliable signals, always ensure the divergence is accompanied by the institutional conviction found in our [Volume Analysis Mastery] guide.
Phase 5: The "Hidden" RSI Power – Trend Failure Swings
An RSI Failure Swing is a specific setup that identifies a trend change before price action confirms it.
- Bullish Failure Swing: RSI drops below 30 (oversold), bounces above 40, drops again but stays above 30, and then breaks its previous peak. This "W" shape on the RSI indicates that buyers have successfully absorbed the selling pressure, even if the price chart looks messy.
Phase 6: Advanced Timeframe Alignment
A momentum signal on a 5-minute chart is a "ripple," while a signal on a Daily chart is a "tidal wave".
- The Top-Down Rule: Always check the RSI and MACD on the Daily or 4-Hour timeframe first to identify the dominant trend bias.
- Execution: Once the Daily trend is bullish (MACD above zero, RSI > 50), zoom in to the 15-minute chart to find entries when the RSI dips into oversold territory. Never trade against the momentum of the higher timeframe.
Phase 7: Common Mistakes and Risk Management
- Chasing Overbought/Oversold: A stock can stay overbought for weeks in a strong uptrend. Never short just because the RSI is at 80; wait for price rejection and a MACD crossover.
- Identifying False Whipsaws: In a tight sideways range, RSI and MACD will "whipsaw" back and forth. Always look for the price to be near a structural zone before trusting an indicator signal.
- Precise Stops: Because momentum can shift rapidly, we utilize [Position Sizing Mastery] to manage our risk. We typically place our stop loss just below the recent swing low that formed during the RSI/MACD confluence event, ensuring a failed momentum shift only costs us 1% of our equity.
Phase 8: Practical Exit Strategies – Ringing the Register
Knowing when to get out is just as important as knowing when to get in.
- RSI Target: If you entered long, consider taking partial profits when the RSI hits 70.
- Histogram Deciphering: Watch for the MACD histogram bars to start shrinking. This indicates that momentum is "fading," and it's time to tighten your stop loss.
- MACD Signal Cross: If the MACD line crosses back below the Signal line, the momentum has officially shifted. This is your cue to exit the position and preserve your capital.
Summary: The Disciplined Momentum Trader
Mastering the RSI and MACD is about building a systematic approach to the market. By waiting for the confluence of price location and momentum confirmation, you stop being a gambler and start being a professional. You are no longer reacting to every tick; you are waiting for the market to prove its strength to you. Believe the indicators, respect the trend, and trade with conviction.